

2007 Benchmarking Report - Alliance for Biking & Walking
2007 Benchmarking Report - Alliance for Biking & Walking
2007 Benchmarking Report - Alliance for Biking & Walking

You also want an ePaper? Increase the reach of your titles
YUMPU automatically turns print PDFs into web optimized ePapers that Google loves.
Bicycling & <strong>Walking</strong> in the U.S./ Thunderhead <strong>Alliance</strong> <strong>2007</strong><br />
90<br />
FACTORS INFLUENCING CYCLING, WALKING, AND SAFETY<br />
percent of trips to work by bicycle<br />
Bike to Work Modeshare<br />
Bicycle to Work Mode Share vs. Cycling Fatality Rates in States<br />
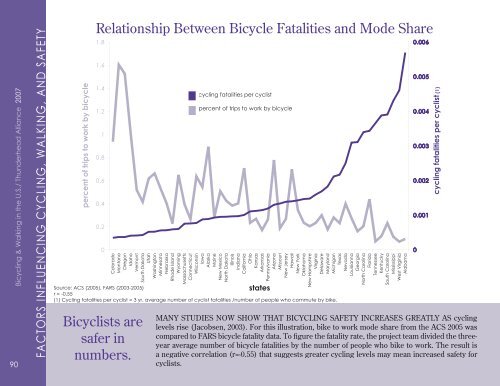
Relationship Between Bicycle Fatalities and Mode Share<br />
1.8<br />
1.6<br />
1.4<br />
1.2<br />
1<br />
0.8<br />
0.6<br />
0.4<br />
0.2<br />
0<br />
Bicyclists are<br />
safer in<br />
numbers.<br />
cycling fatalities per cyclist<br />
percent of trips Bike to Trips<br />
work to by Work<br />
bicycle<br />
Rate of Cycling Fatalities<br />
Colorado<br />
Montana<br />
Oregon<br />
Idaho<br />
Vermont<br />
South Dakota<br />
Utah<br />
Washington<br />
Minnesota<br />
Nebraska<br />
Rhode Island<br />
Wyoming<br />
Massachusetts<br />
Connecticut<br />
Wisconsin<br />
Iowa<br />
Alaska<br />
Maine<br />
New Mexico<br />
North Dakota<br />
Illinois<br />
Indiana<br />
Cali<strong>for</strong>nia<br />
Ohio<br />
Kansas<br />
Arkansas<br />
Pennsylvania<br />
Arizona<br />
Missouri<br />
New Jersey<br />
Hawaii<br />
New York<br />
Oklahoma<br />
New Hampshire<br />
Virginia<br />
Delaware<br />
Maryland<br />
Michigan<br />
Texas<br />
Nevada<br />
Louisianna<br />
Georgia<br />
North Carolina<br />
Florida<br />
Tennessee<br />
Kentucky<br />
South Carolina<br />
Mississippi<br />
West Virginia<br />
Alabama<br />
states<br />
Source: ACS (2005), FARS (2003-2005)<br />
r = -0.55<br />
(1) Cycling fatalities per cyclist = 3 yr. average number of cyclist fatalities /number of people who commute by bike.<br />
MANY STUDIES NOW SHOW THAT BICYCLING SAFETY INCREASES GREATLY AS cycling<br />
levels rise (Jacobsen, 2003). For this illustration, bike to work mode share from the ACS 2005 was<br />
compared to FARS bicycle fatality data. To figure the fatality rate, the project team divided the threeyear<br />
average number of bicycle fatalities by the number of people who bike to work. The result is<br />
a negative correlation (r=-0.55) that suggests greater cycling levels may mean increased safety <strong>for</strong><br />
cyclists.<br />
cycling Rate fatalities of Cycling per Fatalities cyclist (1)
