

2007 Benchmarking Report - Alliance for Biking & Walking
2007 Benchmarking Report - Alliance for Biking & Walking
2007 Benchmarking Report - Alliance for Biking & Walking

You also want an ePaper? Increase the reach of your titles
YUMPU automatically turns print PDFs into web optimized ePapers that Google loves.
Bicycling & <strong>Walking</strong> in the U.S./ Thunderhead <strong>Alliance</strong> <strong>2007</strong><br />
92<br />
FACTORS INFLUENCING CYCLING, WALKING, AND SAFETY<br />
dollars earned by advocacy organizations per 10 city residents/<br />
number of advocacy staff per million people<br />
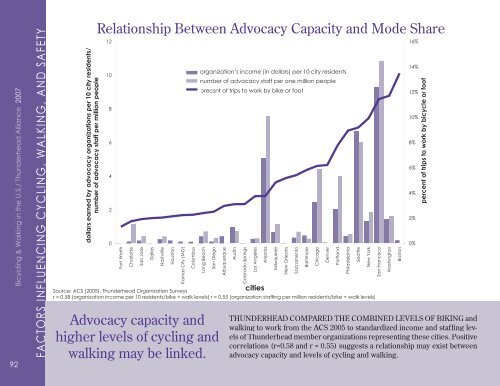
Relationship Between Advocacy Capacity and Mode Share<br />
12<br />
10<br />
8<br />
6<br />
4<br />
2<br />
0<br />
Fort Worth<br />
Charlotte<br />
San Jose<br />
Dallas<br />
Nashville<br />
Houston<br />
Kansas City (MO)<br />
Columbus<br />
Long Beach<br />
San Diego<br />
Source: ACS (2005), Thunderhead Organization Surveys<br />
r = 0.58 (organization income per 10 residents/bike + walk levels) r = 0.55 (organization staffi ng per million residents/bike + walk levels)<br />
Advocacy capacity and<br />
higher levels of cycling and<br />
walking may be linked.<br />
organization’s income (in dollars) per 10 city residents<br />
number of advocacy staff per one million people<br />
precsnt of trips to work by bike or foot<br />
Albuquerque<br />
Austin<br />
Colorado Springs<br />
Los Angeles<br />
Atlanta<br />
cities<br />
Milwaukee<br />
New Orleans<br />
Sacramento<br />
Baltimore<br />
Chicago<br />
Denver<br />
Portland<br />
Philadelphia<br />
THUNDERHEAD COMPARED THE COMBINED LEVELS OF BIKING and<br />
walking to work from the ACS 2005 to standardized income and staffing levels<br />
of Thunderhead member organizations representing these cities. Positive<br />
correlations (r=0.58 and r = 0.55) suggests a relationship may exist between<br />
advocacy capacity and levels of cycling and walking.<br />
Seattle<br />
New York<br />
San Francisco<br />
Washington<br />
Boston<br />
16%<br />
14%<br />
12%<br />
10%<br />
8%<br />
6%<br />
4%<br />
2%<br />
0%<br />
percent of trips to work by bicycle or foot
