2007 Benchmarking Report - Alliance for Biking & Walking
2007 Benchmarking Report - Alliance for Biking & Walking
2007 Benchmarking Report - Alliance for Biking & Walking
Create successful ePaper yourself
Turn your PDF publications into a flip-book with our unique Google optimized e-Paper software.
8: Impacts of Bicycling and<br />
40%<br />
35%<br />
30%<br />
25%<br />
20%<br />
15%<br />
10%<br />
5%<br />
0%<br />
<strong>Walking</strong> on Public Health<br />
Public health and levels of physical activity are inextricably<br />
linked. This report analyzed data on a number of public<br />
health indicators compared to biking and walking levels. Indicators<br />
include obesity and overweight levels (current and<br />
over time), physical activity levels, high blood pressure, and diabetes.<br />
<strong>Biking</strong>, <strong>Walking</strong> and Obesity Levels<br />
Trends Over Time<br />
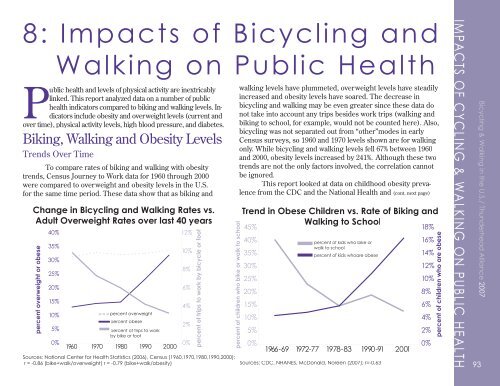
To compare rates of biking and walking with obesity<br />
trends, Census Journey to Work data <strong>for</strong> 1960 through 2000<br />
were compared to overweight and obesity levels in the U.S.<br />
<strong>for</strong> the same time period. These data show that as biking and<br />
Change in Bicycling and <strong>Walking</strong> Rates vs.<br />
Adult Overweight Rates over last 40 years<br />
percent overweight or obese<br />
1960<br />
1970<br />
percent % overweight<br />
percent % obese obese<br />
percent % of trips of trips to to work<br />
by bike or foot or foot<br />
1980<br />
1990<br />
2000<br />
12%<br />
10%<br />
Sources: National Center <strong>for</strong> Health Statistics (2006), Census (1960,1970,1980,1990,2000);<br />
r = -0.86 (bike+walk/overweight) r = -0.79 (bike+walk/obesity)<br />
8%<br />
6%<br />
4%<br />
2%<br />
0%<br />
percent of trips to work by bicycle or foot<br />
percent of children who bike or walk to school<br />
walking levels have plummeted, overweight levels have steadily<br />
increased and obesity levels have soared. The decrease in<br />
bicycling and walking may be even greater since these data do<br />
not take into account any trips besides work trips (walking and<br />
biking to school, <strong>for</strong> example, would not be counted here). Also,<br />
bicycling was not separated out from “other”modes in early<br />
Census surveys, so 1960 and 1970 levels shown are <strong>for</strong> walking<br />
only. While bicycling and walking levels fell 67% between 1960<br />
and 2000, obesity levels increased by 241%. Although these two<br />
trends are not the only factors involved, the correlation cannot<br />
be ignored.<br />
This report looked at data on childhood obesity prevalence<br />
from the CDC and the National Health and (cont. next page)<br />
Trend in Obese Children vs. Rate of <strong>Biking</strong> and<br />
<strong>Walking</strong> to School<br />
45%<br />
40%<br />
35%<br />
30%<br />
25%<br />
20%<br />
15%<br />
10%<br />
5%<br />
0%<br />
1966-69<br />
1972-77<br />
percent of kids who bike or<br />
walk to school<br />
percent of kids whoare obese<br />
1978-83<br />
1990-91<br />
Sources: CDC, NHANES, McDonald, Noreen (<strong>2007</strong>); r=-0.63<br />
2001<br />
18%<br />
16%<br />
14%<br />
12%<br />
10%<br />
8%<br />
6%<br />
4%<br />
2%<br />
0%<br />
percent of children who are obese<br />
IMPACTS OF CYCLING & WALKING ON PUBLIC HEALTH<br />
93<br />
Bicycling & <strong>Walking</strong> in the U.S./ Thunderhead <strong>Alliance</strong> <strong>2007</strong>


