

2007 Benchmarking Report - Alliance for Biking & Walking
2007 Benchmarking Report - Alliance for Biking & Walking
2007 Benchmarking Report - Alliance for Biking & Walking

You also want an ePaper? Increase the reach of your titles
YUMPU automatically turns print PDFs into web optimized ePapers that Google loves.
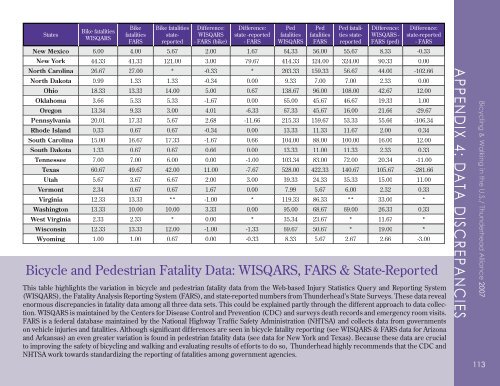
States<br />
Bike fatalities<br />
WISQARS<br />
Bike<br />
fatalities<br />
FARS<br />
Bike fatalities<br />
statereported<br />
Difference:<br />
WISQARS<br />
- FARS (bike)<br />
Difference:<br />
state -reported<br />
- FARS<br />
Ped<br />
fatalities<br />
WISQARS<br />
Ped<br />
fatalities<br />
FARS<br />
Ped fatalities<br />
statereported<br />
Difference:<br />
WISQARS -<br />
FARS (ped)<br />
Difference:<br />
state-reported<br />
- FARS<br />
New Mexico 6.00 4.00 5.67 2.00 1.67 64.33 56.00 55.67 8.33 -0.33<br />
New York 44.33 41.33 121.00 3.00 79.67 414.33 324.00 324.00 90.33 0.00<br />
North Carolina 26.67 27.00 * -0.33 * 203.33 159.33 56.67 44.00 -102.66<br />
North Dakota 0.99 1.33 1.33 -0.34 0.00 9.33 7.00 7.00 2.33 0.00<br />
Ohio 18.33 13.33 14.00 5.00 0.67 138.67 96.00 108.00 42.67 12.00<br />
Oklahoma 3.66 5.33 5.33 -1.67 0.00 65.00 45.67 46.67 19.33 1.00<br />
Oregon 13.34 9.33 3.00 4.01 -6.33 67.33 45.67 16.00 21.66 -29.67<br />
Pennsylvania 20.01 17.33 5.67 2.68 -11.66 215.33 159.67 53.33 55.66 -106.34<br />
Rhode Island 0.33 0.67 0.67 -0.34 0.00 13.33 11.33 11.67 2.00 0.34<br />
South Carolina 15.00 16.67 17.33 -1.67 0.66 104.00 88.00 100.00 16.00 12.00<br />
South Dakota 1.33 0.67 0.67 0.66 0.00 13.33 11.00 11.33 2.33 0.33<br />
Tennessee 7.00 7.00 6.00 0.00 -1.00 103.34 83.00 72.00 20.34 -11.00<br />
Texas 60.67 49.67 42.00 11.00 -7.67 528.00 422.33 140.67 105.67 -281.66<br />
Utah 5.67 3.67 6.67 2.00 3.00 39.33 24.33 35.33 15.00 11.00<br />
Vermont 2.34 0.67 0.67 1.67 0.00 7.99 5.67 6.00 2.32 0.33<br />
Virginia 12.33 13.33 ** -1.00 * 119.33 86.33 ** 33.00 *<br />
Washington 13.33 10.00 10.00 3.33 0.00 95.00 68.67 69.00 26.33 0.33<br />
West Virginia 2.33 2.33 * 0.00 * 35.34 23.67 * 11.67 *<br />
Wisconsin 12.33 13.33 12.00 -1.00 -1.33 69.67 50.67 * 19.00 *<br />
Wyoming 1.00 1.00 0.67 0.00 -0.33 8.33 5.67 2.67 2.66 -3.00<br />
Bicycle and Pedestrian Fatality Data: WISQARS, FARS & State-<strong>Report</strong>ed<br />
This table highlights the variation in bicycle and pedestrian fatality data from the Web-based Injury Statistics Query and <strong>Report</strong>ing System<br />
(WISQARS), the Fatality Analysis <strong>Report</strong>ing System (FARS), and state-reported numbers from Thunderhead’s State Surveys. These data reveal<br />
enormous discrepancies in fatality data among all three data sets. This could be explained partly through the different approach to data collection.<br />
WISQARS is maintained by the Centers <strong>for</strong> Disease Control and Prevention (CDC) and surveys death records and emergency room visits.<br />
FARS is a federal database maintained by the National Highway Traffic Safety Administration (NHTSA) and collects data from governments<br />
on vehicle injuries and fatalities. Although significant differences are seen in bicycle fatality reporting (see WISQARS & FARS data <strong>for</strong> Arizona<br />
and Arkansas) an even greater variation is found in pedestrian fatality data (see data <strong>for</strong> New York and Texas). Because these data are crucial<br />
to improving the safety of bicycling and walking and evaluating results of ef<strong>for</strong>ts to do so, Thunderhead highly recommends that the CDC and<br />
NHTSA work towards standardizing the reporting of fatalities among government agencies.<br />
APPENDIX 4: DATA DISCREPANCIES<br />
Bicycling & <strong>Walking</strong> in the U.S./ Thunderhead <strong>Alliance</strong> <strong>2007</strong><br />
113
