

2007 Benchmarking Report - Alliance for Biking & Walking
2007 Benchmarking Report - Alliance for Biking & Walking
2007 Benchmarking Report - Alliance for Biking & Walking

You also want an ePaper? Increase the reach of your titles
YUMPU automatically turns print PDFs into web optimized ePapers that Google loves.
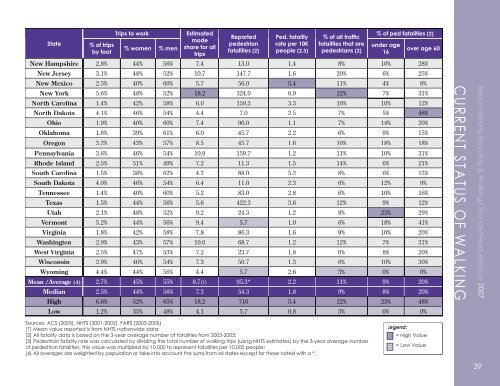
State<br />
% of trips<br />
by foot<br />
Trips to work<br />
% women % men<br />
Estimated<br />
mode<br />
share <strong>for</strong> all<br />
trips<br />
<strong>Report</strong>ed<br />
pedestrian<br />
fatalities (2)<br />
Ped. fatality<br />
rate per 10K<br />
people (2,3)<br />
% of all traffic<br />
fatalities that are<br />
pedestrians (2)<br />
% of ped fatalities (2)<br />
under age<br />
16<br />
over age 60<br />
New Hampshire 2.8% 44% 56% 7.4 13.0 1.4 8% 10% 28%<br />
New Jersey 3.1% 48% 52% 10.7 147.7 1.6 20% 6% 25%<br />
New Mexico 2.5% 40% 60% 5.7 56.0 5.4 11% 4% 8%<br />
New York 5.6% 48% 52% 18.2 324.0 0.9 22% 7% 31%<br />
North Carolina 1.4% 42% 58% 6.0 159.3 3.3 10% 10% 12%<br />
North Dakota 4.1% 46% 54% 4.4 7.0 2.5 7% 5% 48%<br />
Ohio 1.9% 40% 60% 7.4 96.0 1.1 7% 14% 20%<br />
Oklahoma 1.8% 39% 61% 6.0 45.7 2.2 6% 9% 15%<br />
Oregon 3.2% 43% 57% 8.5 45.7 1.6 10% 18% 18%<br />
Pennsylvania 3.6% 46% 54% 10.9 159.7 1.2 11% 10% 31%<br />
Rhode Island 2.5% 51% 49% 7.2 11.3 1.5 14% 6% 21%<br />
South Carolina 1.5% 38% 62% 4.2 88.0 5.2 8% 6% 13%<br />
South Dakota 4.0% 46% 54% 6.4 11.0 2.3 6% 12% 9%<br />
Tennessee 1.4% 40% 60% 5.2 83.0 2.8 6% 10% 16%<br />
Texas 1.5% 44% 56% 5.6 422.3 3.6 12% 9% 12%<br />
Utah 2.1% 48% 52% 9.2 24.3 1.2 8% 23% 29%<br />
Vermont 5.2% 44% 56% 9.4 5.7 1.0 6% 18% 41%<br />
Virginia 1.8% 42% 58% 7.8 86.3 1.6 9% 10% 20%<br />
Washington 2.9% 43% 57% 10.0 68.7 1.2 12% 7% 31%<br />
West Virginia 2.5% 47% 53% 7.2 23.7 1.8 6% 8% 20%<br />
Wisconsin 2.9% 46% 54% 7.3 50.7 1.3 6% 10% 30%<br />
Wyoming 4.4% 44% 56% 4.4 5.7 2.6 3% 0% 0%<br />
Mean /Average (4) 2.7% 45% 55% 8.7(1) 95.3* 2.2 11% 9% 20%<br />
Median 2.5% 44% 56% 7.3 54.3 1.8 9% 8% 20%<br />
High 6.6% 52% 65% 18.2 710 5.4 22% 23% 48%<br />
Low 1.2% 35% 48% 4.1 5.7 0.8 3% 0% 0%<br />
CURRENT STATUS OF WALKING<br />
<strong>Benchmarking</strong> Bicycling & Bicycling <strong>Walking</strong> & in <strong>Walking</strong>/ the U.S./ Thunderhead <strong>Alliance</strong> <strong>2007</strong><br />
Sources: ACS (2005), NHTS (2001-2002), FARS (2003-2005)<br />
(1) Mean value reported is from NHTS nationwide data;<br />
(2) All fatality data is based on the 3-year average number of fatalities from 2003-2005;<br />
(3) Pedestrian fatality rate was calculated by dividing the total number of walking trips (using NHTS estimates) by the 3-year average number<br />
of pedestrian fatalities, this value was multiplied by 10,000 to represent fatalities per 10,000 people;<br />
(4) All averages are weighted by population or take into account the sums from all states except <strong>for</strong> those noted with a *.<br />
Legend:<br />
= High Value<br />
= Low Value<br />
39
