

2007 Benchmarking Report - Alliance for Biking & Walking
2007 Benchmarking Report - Alliance for Biking & Walking
2007 Benchmarking Report - Alliance for Biking & Walking

You also want an ePaper? Increase the reach of your titles
YUMPU automatically turns print PDFs into web optimized ePapers that Google loves.
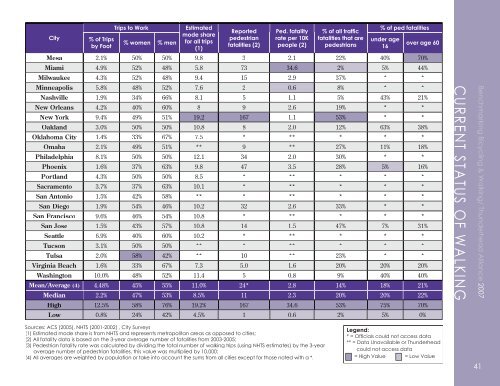
City<br />
% of Trips<br />
by Foot<br />
Trips to Work<br />
% women % men<br />
Estimated<br />
mode share<br />
<strong>for</strong> all trips<br />
(1)<br />
<strong>Report</strong>ed<br />
pedestrian<br />
fatalities (2)<br />
Ped. fatality<br />
rate per 10K<br />
people (2)<br />
% of all traffic<br />
fatalities that are<br />
pedestrians<br />
% of ped fatalities<br />
under age<br />
16<br />
over age 60<br />
Mesa 2.1% 50% 50% 9.8 3 2.1 22% 40% 70%<br />
Miami 4.9% 52% 48% 5.8 73 34.6 2% 5% 44%<br />
Milwaukee 4.3% 52% 48% 9.4 15 2.9 37% * *<br />
Minneapolis 5.8% 48% 52% 7.6 2 0.6 8% * *<br />
Nashville 1.9% 34% 66% 8.1 5 1.1 5% 43% 21%<br />
New Orleans 4.2% 40% 60% 8 9 2.6 19% * *<br />
New York 9.4% 49% 51% 19.2 167 1.1 53% * *<br />
Oakland 3.0% 50% 50% 10.8 8 2.0 12% 63% 38%<br />
Oklahoma City 1.4% 33% 67% 7.5 * ** * * *<br />
Omaha 2.1% 49% 51% ** 9 ** 27% 11% 18%<br />
Philadelphia 8.1% 50% 50% 12.1 34 2.0 30% * *<br />
Phoenix 1.6% 37% 63% 9.8 47 3.5 28% 5% 16%<br />
Portland 4.3% 50% 50% 8.5 * ** * * *<br />
Sacramento 3.7% 37% 63% 10.1 * ** * * *<br />
San Antonio 1.5% 42% 58% ** * ** * * *<br />
San Diego 1.9% 54% 46% 10.2 32 2.6 33% * *<br />
San Francisco 9.6% 46% 54% 10.8 * ** * * *<br />
San Jose 1.5% 43% 57% 10.8 14 1.5 47% 7% 31%<br />
Seattle 6.9% 40% 60% 10.2 * ** * * *<br />
Tucson 3.1% 50% 50% ** * ** * * *<br />
Tulsa 2.0% 58% 42% ** 10 ** 23% * *<br />
Virginia Beach 1.6% 33% 67% 7.3 5.0 1.6 20% 20% 20%<br />
Washington 10.0% 48% 52% 11.4 5 0.8 9% 40% 40%<br />
Mean/Average (4) 4.48% 45% 55% 11.0% 24* 2.8 14% 18% 21%<br />
Median 2.2% 47% 53% 8.5% 11 2.3 20% 20% 22%<br />
High 12.5% 58% 76% 19.2% 167 34.6 53% 75% 70%<br />
Low 0.8% 24% 42% 4.5% 1 0.6 2% 5% 0%<br />
CURRENT STATUS OF WALKING<br />
<strong>Benchmarking</strong> Bicycling & Bicycling <strong>Walking</strong> & in <strong>Walking</strong>/ the U.S./ Thunderhead <strong>Alliance</strong> <strong>2007</strong><br />
Sources: ACS (2005), NHTS (2001-2002) , City Surveys<br />
(1) Estimated mode share is from NHTS and represents metropolitan areas as opposed to cities;<br />
(2) All fatality data is based on the 3-year average number of fatalities from 2003-2005;<br />
(3) Pedestrian fatality rate was calculated by dividing the total number of walking trips (using NHTS estimates) by the 3-year<br />
average number of pedestrian fatalities, this value was multiplied by 10,000;<br />
(4) All averages are weighted by population or take into account the sums from all cities except <strong>for</strong> those noted with a *.<br />
Legend:<br />
* = Offi cials could not access data<br />
** = Data Unavailable or Thunderhead<br />
could not access data<br />
= High Value = Low Value<br />
41
