Mathematica Tutorial: Visualization And Graphics - Wolfram Research
Mathematica Tutorial: Visualization And Graphics - Wolfram Research
Mathematica Tutorial: Visualization And Graphics - Wolfram Research
- No tags were found...

You also want an ePaper? Increase the reach of your titles
YUMPU automatically turns print PDFs into web optimized ePapers that Google loves.
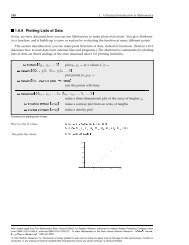
98 <strong>Visualization</strong> and <strong>Graphics</strong><br />
AxesEdge->Automatic<br />
AxesEdge->9xspec,yspec,zspec=<br />
None<br />
Automatic<br />
9dir i ,dir j =<br />
use an internal algorithm to choose where to draw all axes<br />
give separate specifications for each of the x, y and z axes<br />
do not draw this axis<br />
decide automatically where to draw this axis<br />
specify on which of the four possible edges to draw this axis<br />
Specifying where to draw three-dimensional axes.<br />
In[5]:=<br />
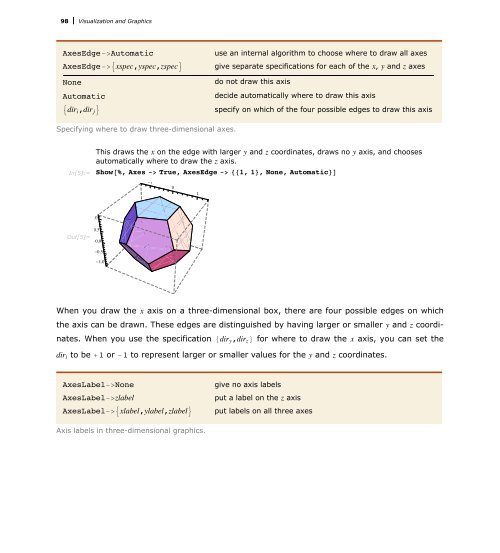
This draws the x on the edge with larger y and z coordinates, draws no y axis, and chooses<br />
automatically where to draw the z axis.<br />
Show@%, Axes -> True, AxesEdge -> 881, 1zlabel<br />
AxesLabel->9xlabel,ylabel,zlabel=<br />
give no axis labels<br />
put a label on the z axis<br />
put labels on all three axes<br />
Axis labels in three-dimensional graphics.