Mathematica Tutorial: Visualization And Graphics - Wolfram Research
Mathematica Tutorial: Visualization And Graphics - Wolfram Research
Mathematica Tutorial: Visualization And Graphics - Wolfram Research
- No tags were found...

Create successful ePaper yourself
Turn your PDF publications into a flip-book with our unique Google optimized e-Paper software.
<strong>Visualization</strong> and <strong>Graphics</strong> 3<br />
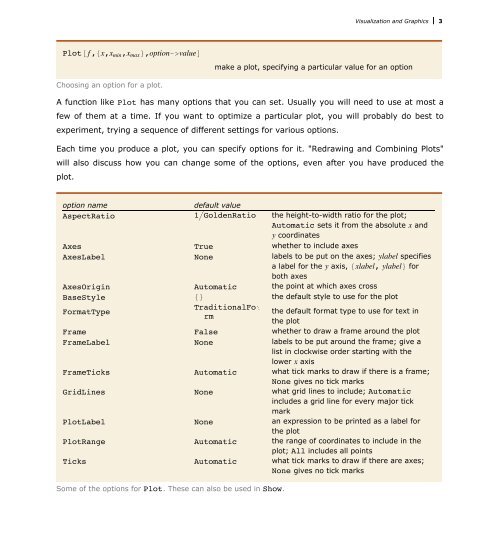
Plot@ f ,8x,x min ,x max valueD<br />
make a plot, specifying a particular value for an option<br />
Choosing an option for a plot.<br />
A function like Plot has many options that you can set. Usually you will need to use at most a<br />
few of them at a time. If you want to optimize a particular plot, you will probably do best to<br />
experiment, trying a sequence of different settings for various options.<br />
Each time you produce a plot, you can specify options for it. "Redrawing and Combining Plots"<br />
will also discuss how you can change some of the options, even after you have produced the<br />
plot.<br />
option name<br />
default value<br />
AspectRatio 1ëGoldenRatio the height-to-width ratio for the plot;<br />
Automatic sets it from the absolute x and<br />
y coordinates<br />
Axes True whether to include axes<br />
AxesLabel None labels to be put on the axes; ylabel specifies<br />
a label for the y axis, 8xlabel, ylabel< for<br />
both axes<br />
AxesOrigin Automatic the point at which axes cross<br />
BaseStyle 8< the default style to use for the plot<br />
FormatType<br />
TraditionalFoÖ<br />
the default format type to use for text in<br />
rm<br />
the plot<br />
Frame False whether to draw a frame around the plot<br />
FrameLabel None labels to be put around the frame; give a<br />
list in clockwise order starting with the<br />
lower x axis<br />
FrameTicks Automatic what tick marks to draw if there is a frame;<br />
None gives no tick marks<br />
GridLines None what grid lines to include; Automatic<br />
includes a grid line for every major tick<br />
mark<br />
PlotLabel None an expression to be printed as a label for<br />
the plot<br />
PlotRange Automatic the range of coordinates to include in the<br />
plot; All includes all points<br />
Ticks Automatic what tick marks to draw if there are axes;<br />
None gives no tick marks<br />
Some of the options for Plot. These can also be used in Show.