Mathematica Tutorial: Visualization And Graphics - Wolfram Research
Mathematica Tutorial: Visualization And Graphics - Wolfram Research
Mathematica Tutorial: Visualization And Graphics - Wolfram Research
- No tags were found...

Create successful ePaper yourself
Turn your PDF publications into a flip-book with our unique Google optimized e-Paper software.
<strong>Visualization</strong> and <strong>Graphics</strong> 45<br />
<strong>Graphics</strong> Directives and Options<br />
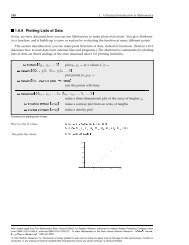
When you set up a graphics object in <strong>Mathematica</strong>, you typically give a list of graphical elements.<br />
You can include in that list graphics directives which specify how subsequent elements<br />
in the list should be rendered.<br />
In general, the graphical elements in a particular graphics object can be given in a collection of<br />
nested lists. When you insert graphics directives in this kind of structure, the rule is that a<br />
particular graphics directive affects all subsequent elements of the list it is in, together with all<br />
elements of sublists that may occur. The graphics directive does not, however, have any effect<br />
outside the list it is in.<br />
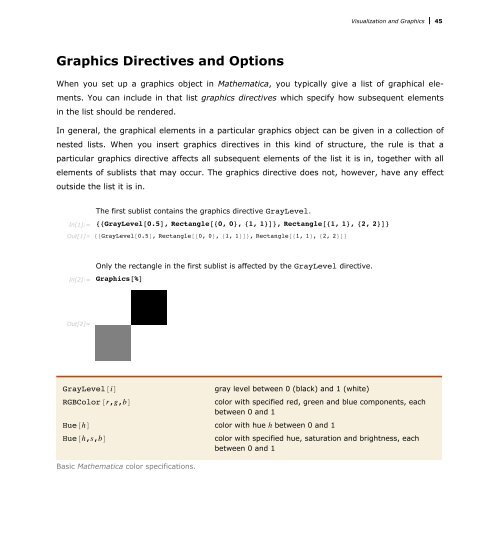
The first sublist contains the graphics directive GrayLevel.<br />
In[1]:= 88GrayLevel@0.5D, Rectangle@80, 0