Mathematica Tutorial: Visualization And Graphics - Wolfram Research
Mathematica Tutorial: Visualization And Graphics - Wolfram Research
Mathematica Tutorial: Visualization And Graphics - Wolfram Research
- No tags were found...

Create successful ePaper yourself
Turn your PDF publications into a flip-book with our unique Google optimized e-Paper software.
<strong>Visualization</strong> and <strong>Graphics</strong> 69<br />
In[4]:=<br />
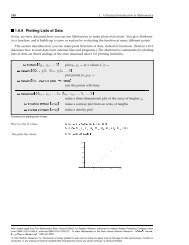
This shows a list of the gradients which can be accessed using ColorData.<br />
ColorData@"Gradients"D<br />
Out[4]= 8DarkRainbow, Rainbow, Pastel, Aquamarine, BrassTones, BrownCyanTones, CherryTones, CoffeeTones,<br />
FuchsiaTones, GrayTones, GrayYellowTones, GreenPinkTones, PigeonTones, RedBlueTones,<br />
RustTones, SiennaTones, ValentineTones, AlpineColors, ArmyColors, AtlanticColors,<br />
AuroraColors, AvocadoColors, BeachColors, CandyColors, CMYKColors, DeepSeaColors, FallColors,<br />
FruitPunchColors, IslandColors, LakeColors, MintColors, NeonColors, PearlColors, PlumColors,<br />
RoseColors, SolarColors, SouthwestColors, StarryNightColors, SunsetColors, ThermometerColors,<br />
WatermelonColors, RedGreenSplit, DarkTerrain, GreenBrownTerrain, LightTerrain,<br />
SandyTerrain, BlueGreenYellow, LightTemperatureMap, TemperatureMap, BrightBands, DarkBands<<br />
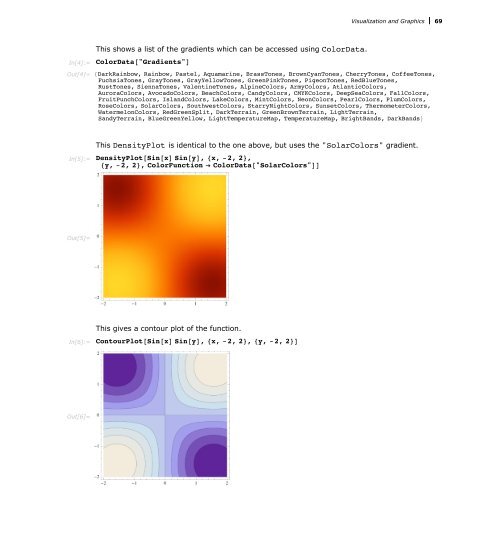
This DensityPlot is identical to the one above, but uses the "SolarColors" gradient.<br />
In[5]:= DensityPlot@Sin@xD Sin@yD, 8x, -2, 2