Mathematica Tutorial: Visualization And Graphics - Wolfram Research
Mathematica Tutorial: Visualization And Graphics - Wolfram Research
Mathematica Tutorial: Visualization And Graphics - Wolfram Research
- No tags were found...

You also want an ePaper? Increase the reach of your titles
YUMPU automatically turns print PDFs into web optimized ePapers that Google loves.
88 <strong>Visualization</strong> and <strong>Graphics</strong><br />
tive zooming of the graphic corresponds directly to changing the ViewAngle option. Interactively<br />
panning the graphic changes values of the ViewCenter option.<br />
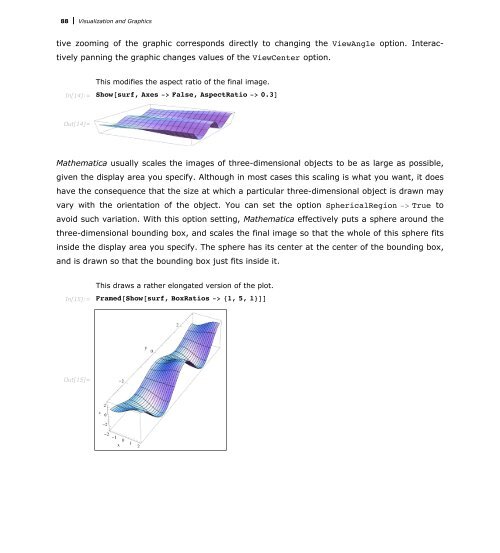
This modifies the aspect ratio of the final image.<br />
In[14]:= Show@surf, Axes -> False, AspectRatio -> 0.3D<br />
Out[14]=<br />
<strong>Mathematica</strong> usually scales the images of three-dimensional objects to be as large as possible,<br />
given the display area you specify. Although in most cases this scaling is what you want, it does<br />
have the consequence that the size at which a particular three-dimensional object is drawn may<br />
vary with the orientation of the object. You can set the option SphericalRegion -> True to<br />
avoid such variation. With this option setting, <strong>Mathematica</strong> effectively puts a sphere around the<br />
three-dimensional bounding box, and scales the final image so that the whole of this sphere fits<br />
inside the display area you specify. The sphere has its center at the center of the bounding box,<br />
and is drawn so that the bounding box just fits inside it.<br />
In[15]:=<br />
This draws a rather elongated version of the plot.<br />
Framed@Show@surf, BoxRatios -> 81, 5, 1