Mathematica Tutorial: Visualization And Graphics - Wolfram Research
Mathematica Tutorial: Visualization And Graphics - Wolfram Research
Mathematica Tutorial: Visualization And Graphics - Wolfram Research
- No tags were found...

Create successful ePaper yourself
Turn your PDF publications into a flip-book with our unique Google optimized e-Paper software.
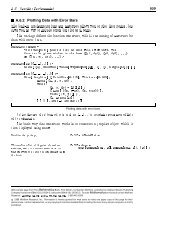
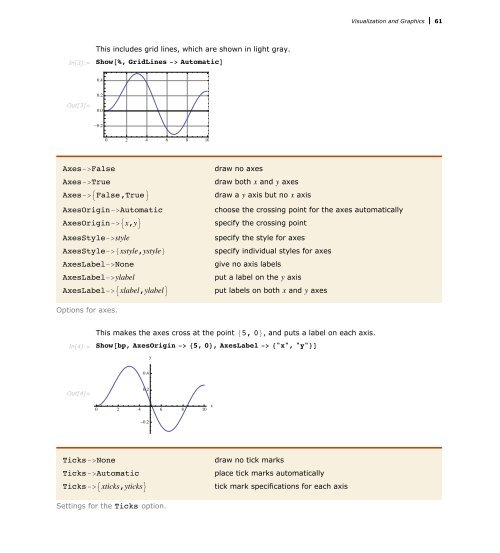
<strong>Visualization</strong> and <strong>Graphics</strong> 61<br />
In[3]:=<br />
This includes grid lines, which are shown in light gray.<br />
Show@%, GridLines -> AutomaticD<br />
0.4<br />
0.2<br />
Out[3]=<br />
0.0<br />
-0.2<br />
0 2 4 6 8 10<br />
Axes->False<br />
Axes->True<br />
Axes->9False,True=<br />
AxesOrigin->Automatic<br />
AxesOrigin->9x,y=<br />
AxesStyle->style<br />
AxesStyle->8xstyle,ystyle<<br />
AxesLabel->None<br />
AxesLabel->ylabel<br />
AxesLabel->9xlabel,ylabel=<br />
draw no axes<br />
draw both x and y axes<br />
draw a y axis but no x axis<br />
choose the crossing point for the axes automatically<br />
specify the crossing point<br />
specify the style for axes<br />
specify individual styles for axes<br />
give no axis labels<br />
put a label on the y axis<br />
put labels on both x and y axes<br />
Options for axes.<br />
In[4]:=<br />
This makes the axes cross at the point 85, 0 85, 0 8"x", "y"None<br />
Ticks->Automatic<br />
Ticks->9xticks,yticks=<br />
draw no tick marks<br />
place tick marks automatically<br />
tick mark specifications for each axis<br />
Settings for the Ticks option.