Mathematica Tutorial: Visualization And Graphics - Wolfram Research
Mathematica Tutorial: Visualization And Graphics - Wolfram Research
Mathematica Tutorial: Visualization And Graphics - Wolfram Research
- No tags were found...

Create successful ePaper yourself
Turn your PDF publications into a flip-book with our unique Google optimized e-Paper software.
<strong>Visualization</strong> and <strong>Graphics</strong> 15<br />
Here is the default setting for the PlotRange option of Plot.<br />
In[1]:=<br />
Options@Plot, PlotRangeD<br />
Out[1]= 8PlotRange Ø 8Full, Automatic AllD;<br />
Until you explicitly reset it, the default for the PlotRange option will now be All.<br />
In[3]:=<br />
Options@Plot, PlotRangeD<br />
Out[3]= 8PlotRange Ø All<<br />
The graphics objects that you get from Plot or Show store information on the options they use.<br />
You can get this information by applying the Options function to these graphics objects.<br />
Options@plotD<br />
Options@plot,optionD<br />
AbsoluteOptions@plot,optionD<br />
show all the options used for a particular plot<br />
show the setting for a specific option<br />
show the absolute form used for a specific option, even if<br />
the setting for the option is Automatic or All<br />
Getting information on options used in plots.<br />
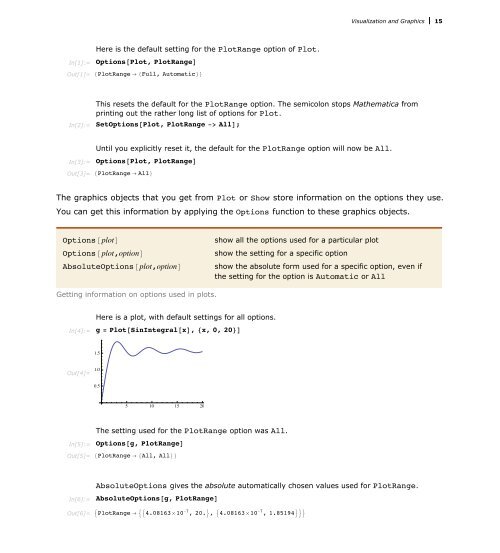
Here is a plot, with default settings for all options.<br />
In[4]:= g = Plot@SinIntegral@xD, 8x, 0, 20