Mathematica Tutorial: Visualization And Graphics - Wolfram Research
Mathematica Tutorial: Visualization And Graphics - Wolfram Research
Mathematica Tutorial: Visualization And Graphics - Wolfram Research
- No tags were found...

You also want an ePaper? Increase the reach of your titles
YUMPU automatically turns print PDFs into web optimized ePapers that Google loves.
<strong>Visualization</strong> and <strong>Graphics</strong> 51<br />
In[17]:=<br />
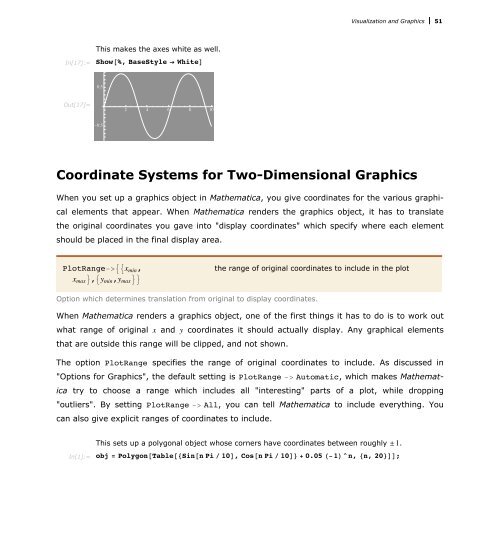
This makes the axes white as well.<br />
Show@%, BaseStyle Ø WhiteD<br />
0.5<br />
Out[17]=<br />
2 4 6 8 10<br />
-0.5<br />
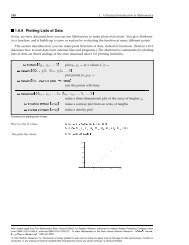
Coordinate Systems for Two-Dimensional <strong>Graphics</strong><br />
When you set up a graphics object in <strong>Mathematica</strong>, you give coordinates for the various graphical<br />
elements that appear. When <strong>Mathematica</strong> renders the graphics object, it has to translate<br />
the original coordinates you gave into "display coordinates" which specify where each element<br />
should be placed in the final display area.<br />
PlotRange->99x min ,<br />
x max =,9y min ,y max ==<br />
the range of original coordinates to include in the plot<br />
Option which determines translation from original to display coordinates.<br />
When <strong>Mathematica</strong> renders a graphics object, one of the first things it has to do is to work out<br />
what range of original x and y coordinates it should actually display. Any graphical elements<br />
that are outside this range will be clipped, and not shown.<br />
The option PlotRange specifies the range of original coordinates to include. As discussed in<br />
"Options for <strong>Graphics</strong>", the default setting is PlotRange -> Automatic, which makes <strong>Mathematica</strong><br />
try to choose a range which includes all "interesting" parts of a plot, while dropping<br />
"outliers". By setting PlotRange -> All, you can tell <strong>Mathematica</strong> to include everything. You<br />
can also give explicit ranges of coordinates to include.<br />
In[1]:=<br />
This sets up a polygonal object whose corners have coordinates between roughly ±1.<br />
obj = Polygon@Table@8Sin@n Pi ê 10D, Cos@n Pi ê 10D< + 0.05 H-1L^n, 8n, 20