- Page 1 and 2: Wolfram Mathematica Tutorial Collec
- Page 3 and 4: Contents Graphics and Sound Basic P
- Page 5 and 6: Graphics and Sound Basic Plotting P
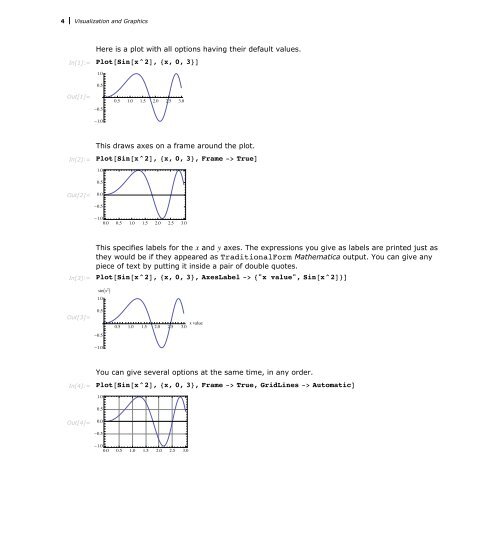
- Page 7: Visualization and Graphics 3 Plot@
- Page 11 and 12: Visualization and Graphics 7 Fillin
- Page 13 and 14: Visualization and Graphics 9 In[15]
- Page 15 and 16: Visualization and Graphics 11 This
- Page 17 and 18: Visualization and Graphics 13 In[10
- Page 19 and 20: Visualization and Graphics 15 Here
- Page 21 and 22: Visualization and Graphics 17 Three
- Page 23 and 24: Visualization and Graphics 19 Here
- Page 25 and 26: Visualization and Graphics 21 Here
- Page 27 and 28: Visualization and Graphics 23 This
- Page 29 and 30: Visualization and Graphics 25 Param
- Page 31 and 32: Visualization and Graphics 27 This
- Page 33 and 34: Visualization and Graphics 29 in wh
- Page 35 and 36: Visualization and Graphics 31 Sound
- Page 37 and 38: Visualization and Graphics 33 PlayR
- Page 39 and 40: Visualization and Graphics 35 In[3]
- Page 41 and 42: Visualization and Graphics 37 Input
- Page 43 and 44: Visualization and Graphics 39 optio
- Page 45 and 46: Visualization and Graphics 41 You c
- Page 47 and 48: Visualization and Graphics 43 This
- Page 49 and 50: Visualization and Graphics 45 Graph
- Page 51 and 52: Visualization and Graphics 47 Here
- Page 53 and 54: Visualization and Graphics 49 Graph
- Page 55 and 56: Visualization and Graphics 51 In[17
- Page 57 and 58: Visualization and Graphics 53 It is
- Page 59 and 60:
Visualization and Graphics 55 In[8]
- Page 61 and 62:
Visualization and Graphics 57 60 Ou
- Page 63 and 64:
Visualization and Graphics 59 20 2
- Page 65 and 66:
Visualization and Graphics 61 In[3]
- Page 67 and 68:
Visualization and Graphics 63 Parti
- Page 69 and 70:
Visualization and Graphics 65 Inset
- Page 71 and 72:
Visualization and Graphics 67 Densi
- Page 73 and 74:
Visualization and Graphics 69 In[4]
- Page 75 and 76:
Visualization and Graphics 71 This
- Page 77 and 78:
Visualization and Graphics 73 If yo
- Page 79 and 80:
Visualization and Graphics 75 In[11
- Page 81 and 82:
Visualization and Graphics 77 In[2]
- Page 83 and 84:
Visualization and Graphics 79 This
- Page 85 and 86:
Visualization and Graphics 81 Coord
- Page 87 and 88:
Visualization and Graphics 83 This
- Page 89 and 90:
Visualization and Graphics 85 In ma
- Page 91 and 92:
Visualization and Graphics 87 This
- Page 93 and 94:
Visualization and Graphics 89 In[16
- Page 95 and 96:
Visualization and Graphics 91 In[3]
- Page 97 and 98:
Visualization and Graphics 93 In[7]
- Page 99 and 100:
Visualization and Graphics 95 GrayL
- Page 101 and 102:
Visualization and Graphics 97 In[3]
- Page 103 and 104:
Visualization and Graphics 99 In[6]
- Page 105 and 106:
Visualization and Graphics 101 Grap
- Page 107 and 108:
Formats for Text in Graphics 103 Ba
- Page 109 and 110:
Visualization and Graphics 105 In[6
- Page 111 and 112:
Visualization and Graphics 107 In[1
- Page 113 and 114:
Visualization and Graphics 109 In a
- Page 115 and 116:
Visualization and Graphics 111 "EPS
- Page 117 and 118:
Visualization and Graphics 113 Impo
- Page 119 and 120:
Visualization and Graphics 115 Edit
- Page 121 and 122:
Visualization and Graphics 117 Sele
- Page 123 and 124:
Visualization and Graphics 119 To S
- Page 125 and 126:
Visualization and Graphics 121 Draw
- Page 127 and 128:
Visualization and Graphics 123 Draw
- Page 129 and 130:
Visualization and Graphics 125 Draw
- Page 131 and 132:
Visualization and Graphics 127 Get
- Page 133 and 134:
Visualization and Graphics 129 Clic
- Page 135 and 136:
Visualization and Graphics 131 Shif
- Page 137 and 138:
Visualization and Graphics 133 Copy
- Page 139 and 140:
Visualization and Graphics 135 Past
- Page 141 and 142:
Visualization and Graphics 137 Doub
- Page 143 and 144:
Visualization and Graphics 139 You
- Page 145 and 146:
Visualization and Graphics 141 Move
- Page 147 and 148:
Visualization and Graphics 143 Move
- Page 149 and 150:
Visualization and Graphics 145 Rect
- Page 151 and 152:
Visualization and Graphics 147 Drag
- Page 153 and 154:
Visualization and Graphics 149 Clic
- Page 155 and 156:
Visualization and Graphics 151 Resh
- Page 157 and 158:
Visualization and Graphics 153 Drag
- Page 159 and 160:
Visualization and Graphics 155 Resh
- Page 161 and 162:
Visualization and Graphics 157 Clic
- Page 163 and 164:
Visualization and Graphics 159 Drag
- Page 165 and 166:
Visualization and Graphics 161 Crop
- Page 167 and 168:
Visualization and Graphics 163 To g
- Page 169 and 170:
Visualization and Graphics 165 Rota