Mathematica Tutorial: Visualization And Graphics - Wolfram Research
Mathematica Tutorial: Visualization And Graphics - Wolfram Research
Mathematica Tutorial: Visualization And Graphics - Wolfram Research
- No tags were found...

You also want an ePaper? Increase the reach of your titles
YUMPU automatically turns print PDFs into web optimized ePapers that Google loves.
64 <strong>Visualization</strong> and <strong>Graphics</strong><br />
In[9]:=<br />
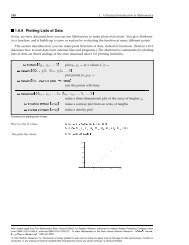
This draws frame axes, and labels each of them.<br />
Show@bp, Frame -> True,<br />
FrameLabel -> 88"left label", "right label"9xgrid,ygrid=<br />
draw no grid lines<br />
position grid lines automatically<br />
specify grid lines in analogy with tick marks<br />
Options for grid lines.<br />
Grid lines in <strong>Mathematica</strong> work very much like tick marks. As with tick marks, you can specify<br />
explicit positions for grid lines. There is no label or length to specify for grid lines. However, you<br />
can specify a style.<br />
In[10]:=<br />
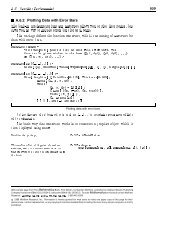
This generates x but not y grid lines.<br />
Show@bp, GridLines -> 8Automatic, None