Mathematica Tutorial: Visualization And Graphics - Wolfram Research
Mathematica Tutorial: Visualization And Graphics - Wolfram Research
Mathematica Tutorial: Visualization And Graphics - Wolfram Research
- No tags were found...

You also want an ePaper? Increase the reach of your titles
YUMPU automatically turns print PDFs into web optimized ePapers that Google loves.
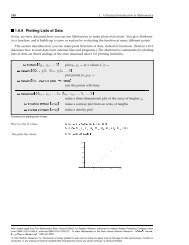
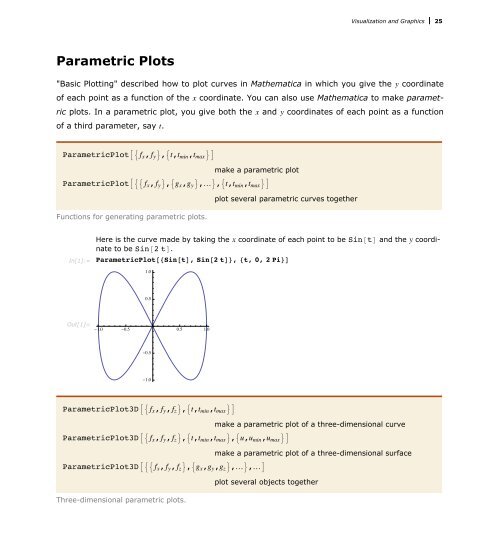
<strong>Visualization</strong> and <strong>Graphics</strong> 25<br />
Parametric Plots<br />
"Basic Plotting" described how to plot curves in <strong>Mathematica</strong> in which you give the y coordinate<br />
of each point as a function of the x coordinate. You can also use <strong>Mathematica</strong> to make parametric<br />
plots. In a parametric plot, you give both the x and y coordinates of each point as a function<br />
of a third parameter, say t.<br />
ParametricPlotA9 f x , f y =,9t,t min ,t max =E<br />
make a parametric plot<br />
ParametricPlotA99 f x , f y =,9g x ,g y =,…=,9t,t min ,t max =E<br />
plot several parametric curves together<br />
Functions for generating parametric plots.<br />
In[1]:=<br />
Here is the curve made by taking the x coordinate of each point to be Sin@tD and the y coordinate<br />
to be Sin@2 tD.<br />
ParametricPlot@8Sin@tD, Sin@2 tD