Mathematica Tutorial: Visualization And Graphics - Wolfram Research
Mathematica Tutorial: Visualization And Graphics - Wolfram Research
Mathematica Tutorial: Visualization And Graphics - Wolfram Research
- No tags were found...

Create successful ePaper yourself
Turn your PDF publications into a flip-book with our unique Google optimized e-Paper software.
Formats for Text in <strong>Graphics</strong><br />
103<br />
BaseStyle->value<br />
an option for the text style in a graphic<br />
FormatType->value<br />
an option for the text format type in a graphic<br />
Specifying formats for text in graphics.<br />
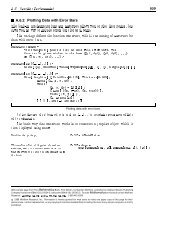
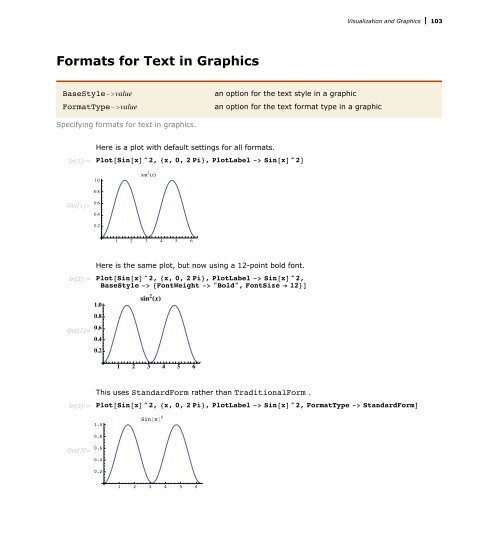
Here is a plot with default settings for all formats.<br />
In[1]:= Plot@Sin@xD^2, 8x, 0, 2 Pi Sin@xD^2D<br />
sin 2 HxL<br />
1.0<br />
0.8<br />
Out[1]=<br />
0.6<br />
0.4<br />
0.2<br />
1 2 3 4 5 6<br />
Here is the same plot, but now using a 12-point bold font.<br />
In[2]:= Plot@Sin@xD^2, 8x, 0, 2 Pi Sin@xD^2,<br />
BaseStyle -> 8FontWeight -> "Bold", FontSize Ø 12 StandardFormD<br />
1.0<br />
0.8<br />
Out[3]=<br />
0.6<br />
0.4<br />
0.2<br />
1 2 3 4 5 6