Mathematica Tutorial: Visualization And Graphics - Wolfram Research
Mathematica Tutorial: Visualization And Graphics - Wolfram Research
Mathematica Tutorial: Visualization And Graphics - Wolfram Research
- No tags were found...

Create successful ePaper yourself
Turn your PDF publications into a flip-book with our unique Google optimized e-Paper software.
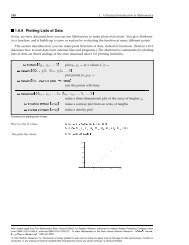
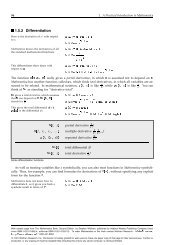
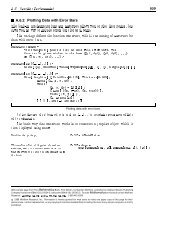
70 <strong>Visualization</strong> and <strong>Graphics</strong><br />
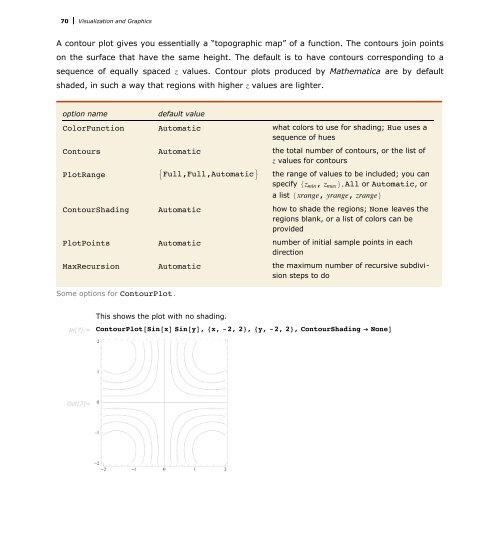
A contour plot gives you essentially a “topographic map” of a function. The contours join points<br />
on the surface that have the same height. The default is to have contours corresponding to a<br />
sequence of equally spaced z values. Contour plots produced by <strong>Mathematica</strong> are by default<br />
shaded, in such a way that regions with higher z values are lighter.<br />
option name<br />
default value<br />
ColorFunction Automatic what colors to use for shading; Hue uses a<br />
sequence of hues<br />
Contours Automatic the total number of contours, or the list of<br />
z values for contours<br />
PlotRange 9Full,Full,Automatic= the range of values to be included; you can<br />
specify 8z min , z max