Department of Tourism - ANNUAL REPORT 2010/11
Department of Tourism - ANNUAL REPORT 2010/11
Department of Tourism - ANNUAL REPORT 2010/11

You also want an ePaper? Increase the reach of your titles
YUMPU automatically turns print PDFs into web optimized ePapers that Google loves.
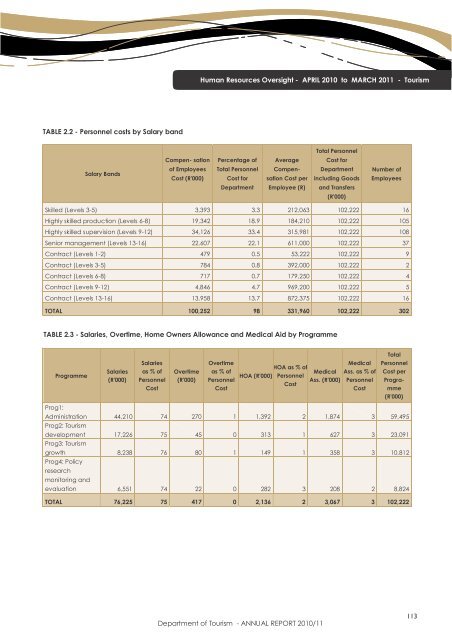
Human Resources Oversight - APRIL <strong>2010</strong> to MARCH 20<strong>11</strong> - <strong>Tourism</strong><br />
TABLE 2.2 - Personnel costs by Salary band<br />
Total Personnel<br />
Compen- sation<br />
Percentage <strong>of</strong><br />
Average<br />
Cost for<br />
Salary Bands<br />
<strong>of</strong> Employees<br />
Cost (R'000)<br />
Total Personnel<br />
Cost for<br />
Compensation<br />
Cost per<br />
<strong>Department</strong><br />
including Goods<br />
Number <strong>of</strong><br />
Employees<br />
<strong>Department</strong><br />
Employee (R)<br />
and Transfers<br />
(R'000)<br />
Skilled (Levels 3-5) 3,393 3.3 212,063 102,222 16<br />
Highly skilled production (Levels 6-8) 19,342 18.9 184,210 102,222 105<br />
Highly skilled supervision (Levels 9-12) 34,126 33.4 315,981 102,222 108<br />
Senior management (Levels 13-16) 22,607 22.1 6<strong>11</strong>,000 102,222 37<br />
Contract (Levels 1-2) 479 0.5 53,222 102,222 9<br />
Contract (Levels 3-5) 784 0.8 392,000 102,222 2<br />
Contract (Levels 6-8) 717 0.7 179,250 102,222 4<br />
Contract (Levels 9-12) 4,846 4.7 969,200 102,222 5<br />
Contract (Levels 13-16) 13,958 13.7 872,375 102,222 16<br />
TOTAL 100,252 98 331,960 102,222 302<br />
TABLE 2.3 - Salaries, Overtime, Home Owners Allowance and Medical Aid by Programme<br />
Total<br />
Programme<br />
Salaries<br />
(R'000)<br />
Salaries<br />
as % <strong>of</strong><br />
Personnel<br />
Cost<br />
Overtime<br />
(R'000)<br />
Overtime<br />
as % <strong>of</strong><br />
Personnel<br />
Cost<br />
HOA (R'000)<br />
HOA as % <strong>of</strong><br />
Personnel<br />
Cost<br />
Medical<br />
Ass. (R'000)<br />
Medical<br />
Ass. as % <strong>of</strong><br />
Personnel<br />
Cost<br />
Personnel<br />
Cost per<br />
Progra-<br />
mme<br />
(R'000)<br />
Prog1:<br />
Administration 44,210 74 270 1 1,392 2 1,874 3 59,495<br />
Prog2: <strong>Tourism</strong><br />
development 17,226 75 45 0 313 1 627 3 23,091<br />
Prog3: <strong>Tourism</strong><br />
growth 8,238 76 80 1 149 1 358 3 10,812<br />
Prog4: Policy<br />
research<br />
monitoring and<br />
evaluation 6,551 74 22 0 282 3 208 2 8,824<br />
TOTAL 76,225 75 417 0 2,136 2 3,067 3 102,222<br />
<strong>Department</strong> <strong>of</strong> <strong>Tourism</strong> - <strong>ANNUAL</strong> <strong>REPORT</strong> <strong>2010</strong>/<strong>11</strong><br />
<strong>11</strong>3