Department of Tourism - ANNUAL REPORT 2010/11
Department of Tourism - ANNUAL REPORT 2010/11
Department of Tourism - ANNUAL REPORT 2010/11

You also want an ePaper? Increase the reach of your titles
YUMPU automatically turns print PDFs into web optimized ePapers that Google loves.
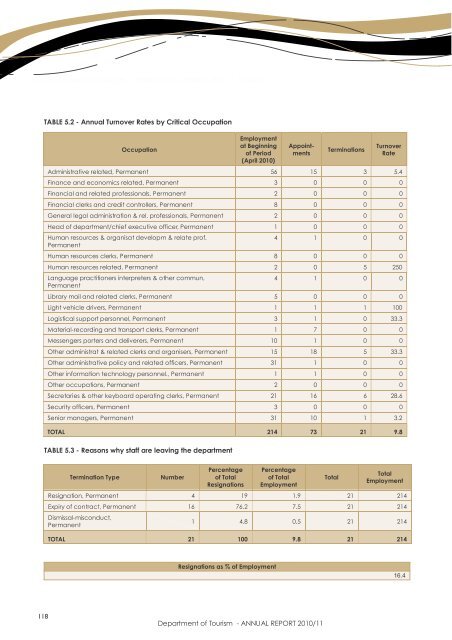
Human Resources Oversight - APRIL <strong>2010</strong> to MARCH 20<strong>11</strong> - <strong>Tourism</strong><br />
TABLE 5.2 - Annual Turnover Rates by Critical Occupation<br />
Occupation<br />
Employment<br />
at Beginning<br />
<strong>of</strong> Period<br />
(April <strong>2010</strong>)<br />
Appointments<br />
Terminations<br />
Turnover<br />
Rate<br />
Administrative related, Permanent 56 15 3 5.4<br />
Finance and economics related, Permanent 3 0 0 0<br />
Financial and related pr<strong>of</strong>essionals, Permanent 2 0 0 0<br />
Financial clerks and credit controllers, Permanent 8 0 0 0<br />
General legal administration & rel. pr<strong>of</strong>essionals, Permanent 2 0 0 0<br />
Head <strong>of</strong> department/chief executive <strong>of</strong>ficer, Permanent 1 0 0 0<br />
Human resources & organisat developm & relate pr<strong>of</strong>,<br />
Permanent<br />
4 1 0 0<br />
Human resources clerks, Permanent 8 0 0 0<br />
Human resources related, Permanent 2 0 5 250<br />
Language practitioners interpreters & other commun,<br />
Permanent<br />
4 1 0 0<br />
Library mail and related clerks, Permanent 5 0 0 0<br />
Light vehicle drivers, Permanent 1 1 1 100<br />
Logistical support personnel, Permanent 3 1 0 33.3<br />
Material-recording and transport clerks, Permanent 1 7 0 0<br />
Messengers porters and deliverers, Permanent 10 1 0 0<br />
Other administrat & related clerks and organisers, Permanent 15 18 5 33.3<br />
Other administrative policy and related <strong>of</strong>ficers, Permanent 31 1 0 0<br />
Other information technology personnel., Permanent 1 1 0 0<br />
Other occupations, Permanent 2 0 0 0<br />
Secretaries & other keyboard operating clerks, Permanent 21 16 6 28.6<br />
Security <strong>of</strong>ficers, Permanent 3 0 0 0<br />
Senior managers, Permanent 31 10 1 3.2<br />
TOTAL 214 73 21 9.8<br />
TABLE 5.3 - Reasons why staff are leaving the department<br />
Termination Type<br />
Number<br />
Percentage<br />
<strong>of</strong> Total<br />
Resignations<br />
Percentage<br />
<strong>of</strong> Total<br />
Employment<br />
Total<br />
Total<br />
Employment<br />
Resignation, Permanent 4 19 1.9 21 214<br />
Expiry <strong>of</strong> contract, Permanent 16 76.2 7.5 21 214<br />
Dismissal-misconduct,<br />
Permanent<br />
1 4.8 0.5 21 214<br />
TOTAL 21 100 9.8 21 214<br />
Resignations as % <strong>of</strong> Employment<br />
16.4<br />
<strong>11</strong>8<br />
<strong>Department</strong> <strong>of</strong> <strong>Tourism</strong> - <strong>ANNUAL</strong> <strong>REPORT</strong> <strong>2010</strong>/<strong>11</strong>