

Mapping Diversity: Developing a European Classification of ... - U-Map
Mapping Diversity: Developing a European Classification of ... - U-Map
Mapping Diversity: Developing a European Classification of ... - U-Map

Create successful ePaper yourself
Turn your PDF publications into a flip-book with our unique Google optimized e-Paper software.
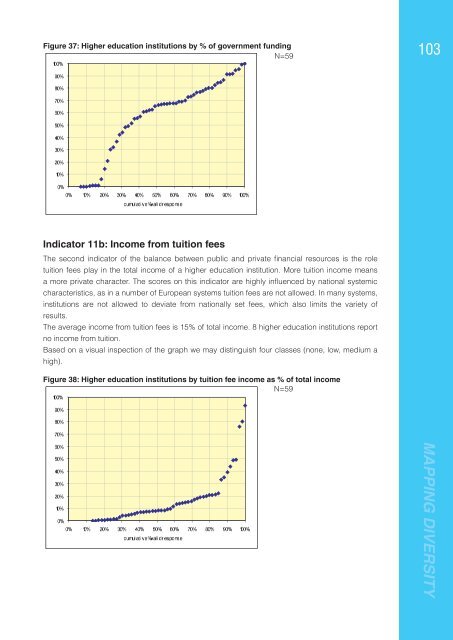
Figure 37: Higher education institutions by % <strong>of</strong> government funding<br />
N=59<br />
103<br />
100%<br />
90%<br />
80%<br />
70%<br />
60%<br />
50%<br />
40%<br />
30%<br />
20%<br />
10%<br />
0%<br />
0% 10% 20% 30% 40% 50% 60% 70% 80% 90% 100%<br />
cumulative %val i d r esponse<br />
Indicator 11b: Income from tuition fees<br />
The second indicator <strong>of</strong> the balance between public and private fi nancial resources is the role<br />
tuition fees play in the total income <strong>of</strong> a higher education institution. More tuition income means<br />
a more private character. The scores on this indicator are highly infl uenced by national systemic<br />
characteristics, as in a number <strong>of</strong> <strong>European</strong> systems tuition fees are not allowed. In many systems,<br />
institutions are not allowed to deviate from nationally set fees, which also limits the variety <strong>of</strong><br />
results.<br />
The average income from tuition fees is 15% <strong>of</strong> total income. 8 higher education institutions report<br />
no income from tuition.<br />
Based on a visual inspection <strong>of</strong> the graph we may distinguish four classes (none, low, medium a<br />
high).<br />
Figure 38: Higher education institutions by tuition fee income as % <strong>of</strong> total income<br />
N=59<br />
100%<br />
90%<br />
80%<br />
70%<br />
60%<br />
50%<br />
40%<br />
30%<br />
20%<br />
10%<br />
0%<br />
40% 50% 60% 70% 80% 90% 100%<br />
0% 10% 20% 30%<br />
r esponse d i %val cumulative<br />
MAPPING DIVERSITY


