Mapping Diversity: Developing a European Classification of ... - U-Map
Mapping Diversity: Developing a European Classification of ... - U-Map
Mapping Diversity: Developing a European Classification of ... - U-Map
Create successful ePaper yourself
Turn your PDF publications into a flip-book with our unique Google optimized e-Paper software.
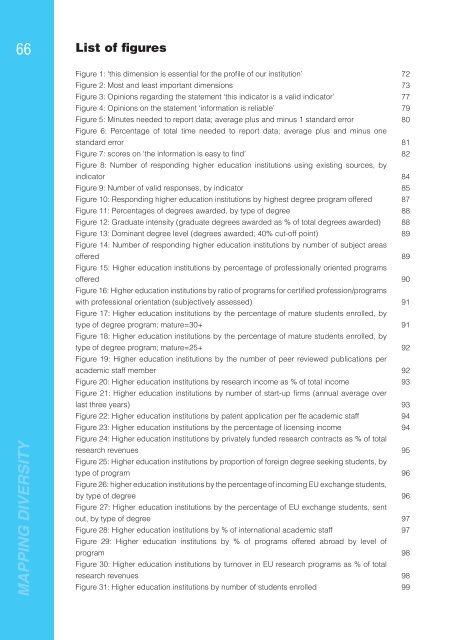
66 List <strong>of</strong> figures<br />
MAPPING DIVERSITY<br />
Figure 1: ‘this dimension is essential for the pr<strong>of</strong>i le <strong>of</strong> our institution’<br />
Figure 2: Most and least important dimensions<br />
Figure 3: Opinions regarding the statement ‘this indicator is a valid indicator’<br />
Figure 4: Opinions on the statement ‘information is reliable’<br />
Figure 5: Minutes needed to report data; average plus and minus 1 standard error<br />
Figure 6: Percentage <strong>of</strong> total time needed to report data; average plus and minus one<br />
standard error<br />
Figure 7: scores on ‘the information is easy to fi nd’<br />
Figure 8: Number <strong>of</strong> responding higher education institutions using existing sources, by<br />
indicator<br />
Figure 9: Number <strong>of</strong> valid responses, by indicator<br />
Figure 10: Responding higher education institutions by highest degree program <strong>of</strong>fered<br />
Figure 11: Percentages <strong>of</strong> degrees awarded, by type <strong>of</strong> degree<br />
Figure 12: Graduate intensity (graduate degrees awarded as % <strong>of</strong> total degrees awarded)<br />
Figure 13: Dominant degree level (degrees awarded; 40% cut-<strong>of</strong>f point)<br />
Figure 14: Number <strong>of</strong> responding higher education institutions by number <strong>of</strong> subject areas<br />
<strong>of</strong>fered<br />
Figure 15: Higher education institutions by percentage <strong>of</strong> pr<strong>of</strong>essionally oriented programs<br />
<strong>of</strong>fered<br />
Figure 16: Higher education institutions by ratio <strong>of</strong> programs for certifi ed pr<strong>of</strong>ession/programs<br />
with pr<strong>of</strong>essional orientation (subjectively assessed)<br />
Figure 17: Higher education institutions by the percentage <strong>of</strong> mature students enrolled, by<br />
type <strong>of</strong> degree program; mature=30+<br />
Figure 18: Higher education institutions by the percentage <strong>of</strong> mature students enrolled, by<br />
type <strong>of</strong> degree program; mature=25+<br />
Figure 19: Higher education institutions by the number <strong>of</strong> peer reviewed publications per<br />
academic staff member<br />
Figure 20: Higher education institutions by research income as % <strong>of</strong> total income<br />
Figure 21: Higher education institutions by number <strong>of</strong> start-up fi rms (annual average over<br />
last three years)<br />
Figure 22: Higher education institutions by patent application per fte academic staff<br />
Figure 23: Higher education institutions by the percentage <strong>of</strong> licensing income<br />
Figure 24: Higher education institutions by privately funded research contracts as % <strong>of</strong> total<br />
research revenues<br />
Figure 25: Higher education institutions by proportion <strong>of</strong> foreign degree seeking students, by<br />
type <strong>of</strong> program<br />
Figure 26: higher education institutions by the percentage <strong>of</strong> incoming EU exchange students,<br />
by type <strong>of</strong> degree<br />
Figure 27: Higher education institutions by the percentage <strong>of</strong> EU exchange students, sent<br />
out, by type <strong>of</strong> degree<br />
Figure 28: Higher education institutions by % <strong>of</strong> international academic staff<br />
Figure 29: Higher education institutions by % <strong>of</strong> programs <strong>of</strong>fered abroad by level <strong>of</strong><br />
program<br />
Figure 30: Higher education institutions by turnover in EU research programs as % <strong>of</strong> total<br />
research revenues<br />
Figure 31: Higher education institutions by number <strong>of</strong> students enrolled<br />
72<br />
73<br />
77<br />
79<br />
80<br />
81<br />
82<br />
84<br />
85<br />
87<br />
88<br />
88<br />
89<br />
89<br />
90<br />
91<br />
91<br />
92<br />
92<br />
93<br />
93<br />
94<br />
94<br />
95<br />
96<br />
96<br />
97<br />
97<br />
98<br />
98<br />
99


