

Mapping Diversity: Developing a European Classification of ... - U-Map
Mapping Diversity: Developing a European Classification of ... - U-Map
Mapping Diversity: Developing a European Classification of ... - U-Map

Create successful ePaper yourself
Turn your PDF publications into a flip-book with our unique Google optimized e-Paper software.
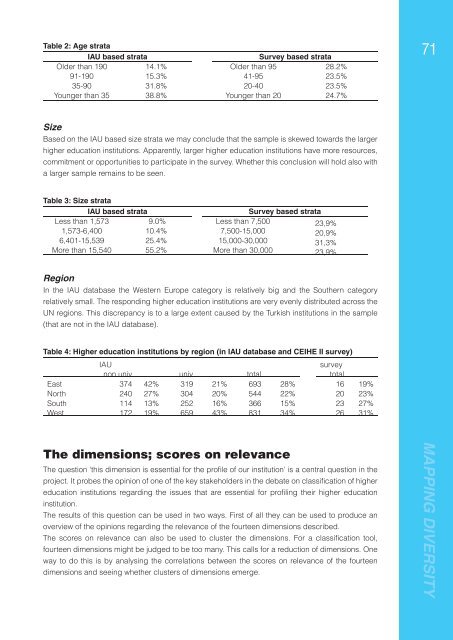
Table 2: Age strata<br />
IAU based strata<br />
Survey based strata<br />
Older than 190 14.1% Older than 95 28.2%<br />
91-190 15.3% 41-95 23.5%<br />
35-90 31.8% 20-40 23.5%<br />
Younger than 35 38.8% Younger than 20 24.7%<br />
71<br />
Size<br />
Based on the IAU based size strata we may conclude that the sample is skewed towards the larger<br />
higher education institutions. Apparently, larger higher education institutions have more resources,<br />
commitment or opportunities to participate in the survey. Whether this conclusion will hold also with<br />
a larger sample remains to be seen.<br />
Table 3: Size strata<br />
IAU based strata<br />
Survey based strata<br />
Less than 1,573 9.0% Less than 7,500 23,9%<br />
1,573-6,400 10.4% 7,500-15,000 20,9%<br />
6,401-15,539 25.4% 15,000-30,000 31,3%<br />
More than 15,540 55.2% More than 30,000 23,9%<br />
Region<br />
In the IAU database the Western Europe category is relatively big and the Southern category<br />
relatively small. The responding higher education institutions are very evenly distributed across the<br />
UN regions. This discrepancy is to a large extent caused by the Turkish institutions in the sample<br />
(that are not in the IAU database).<br />
Table 4: Higher education institutions by region (in IAU database and CEIHE II survey)<br />
IAU<br />
survey<br />
non univ univ total total<br />
East 374 42% 319 21% 693 28% 16 19%<br />
North 240 27% 304 20% 544 22% 20 23%<br />
South 114 13% 252 16% 366 15% 23 27%<br />
West 172 19% 659 43% 831 34% 26 31%<br />
The dimensions; scores on relevance<br />
The question ‘this dimension is essential for the pr<strong>of</strong>i le <strong>of</strong> our institution’ is a central question in the<br />
project. It probes the opinion <strong>of</strong> one <strong>of</strong> the key stakeholders in the debate on classifi cation <strong>of</strong> higher<br />
education institutions regarding the issues that are essential for pr<strong>of</strong>i ling their higher education<br />
institution.<br />
The results <strong>of</strong> this question can be used in two ways. First <strong>of</strong> all they can be used to produce an<br />
overview <strong>of</strong> the opinions regarding the relevance <strong>of</strong> the fourteen dimensions described.<br />
The scores on relevance can also be used to cluster the dimensions. For a classifi cation tool,<br />
fourteen dimensions might be judged to be too many. This calls for a reduction <strong>of</strong> dimensions. One<br />
way to do this is by analysing the correlations between the scores on relevance <strong>of</strong> the fourteen<br />
dimensions and seeing whether clusters <strong>of</strong> dimensions emerge.<br />
MAPPING DIVERSITY


