

Mapping Diversity: Developing a European Classification of ... - U-Map
Mapping Diversity: Developing a European Classification of ... - U-Map
Mapping Diversity: Developing a European Classification of ... - U-Map

Create successful ePaper yourself
Turn your PDF publications into a flip-book with our unique Google optimized e-Paper software.
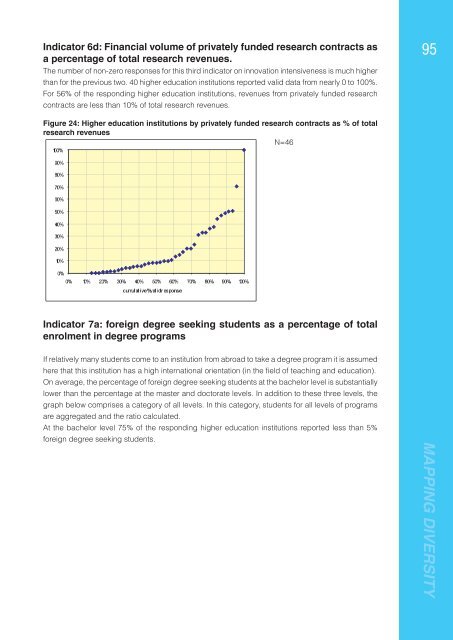
Indicator 6d: Financial volume <strong>of</strong> privately funded research contracts as<br />
a percentage <strong>of</strong> total research revenues.<br />
The number <strong>of</strong> non-zero responses for this third indicator on innovation intensiveness is much higher<br />
than for the previous two. 40 higher education institutions reported valid data from nearly 0 to 100%.<br />
For 56% <strong>of</strong> the responding higher education institutions, revenues from privately funded research<br />
contracts are less than 10% <strong>of</strong> total research revenues.<br />
95<br />
Figure 24: Higher education institutions by privately funded research contracts as % <strong>of</strong> total<br />
research revenues<br />
N=46<br />
100%<br />
90%<br />
80%<br />
70%<br />
60%<br />
50%<br />
40%<br />
30%<br />
20%<br />
10%<br />
0%<br />
0% 10% 20% 30% 40% 50% 60% 70% 80% 90% 100%<br />
cumulative %val i d r esponse<br />
Indicator 7a: foreign degree seeking students as a percentage <strong>of</strong> total<br />
enrolment in degree programs<br />
If relatively many students come to an institution from abroad to take a degree program it is assumed<br />
here that this institution has a high international orientation (in the fi eld <strong>of</strong> teaching and education).<br />
On average, the percentage <strong>of</strong> foreign degree seeking students at the bachelor level is substantially<br />
lower than the percentage at the master and doctorate levels. In addition to these three levels, the<br />
graph below comprises a category <strong>of</strong> all levels. In this category, students for all levels <strong>of</strong> programs<br />
are aggregated and the ratio calculated.<br />
At the bachelor level 75% <strong>of</strong> the responding higher education institutions reported less than 5%<br />
foreign degree seeking students.<br />
MAPPING DIVERSITY


