

Mapping Diversity: Developing a European Classification of ... - U-Map
Mapping Diversity: Developing a European Classification of ... - U-Map
Mapping Diversity: Developing a European Classification of ... - U-Map

You also want an ePaper? Increase the reach of your titles
YUMPU automatically turns print PDFs into web optimized ePapers that Google loves.
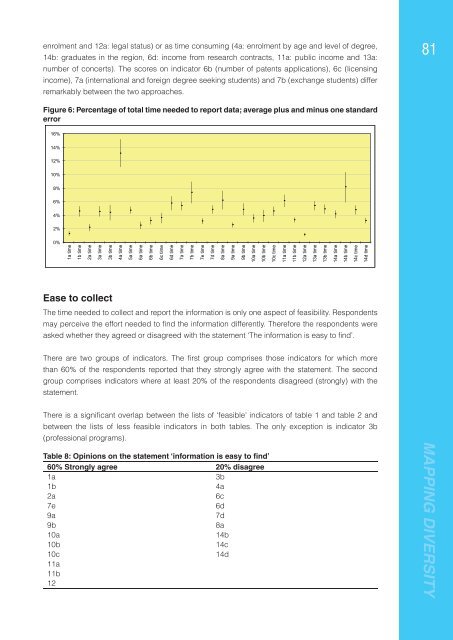
enrolment and 12a: legal status) or as time consuming (4a: enrolment by age and level <strong>of</strong> degree,<br />
14b: graduates in the region, 6d: income from research contracts, 11a: public income and 13a:<br />
number <strong>of</strong> concerts). The scores on indicator 6b (number <strong>of</strong> patents applications), 6c (licensing<br />
income), 7a (international and foreign degree seeking students) and 7b (exchange students) differ<br />
remarkably between the two approaches.<br />
81<br />
Figure 6: Percentage <strong>of</strong> total time needed to report data; average plus and minus one standard<br />
error<br />
16%<br />
14%<br />
12%<br />
10%<br />
8%<br />
6%<br />
4%<br />
2%<br />
0%<br />
1a time<br />
1b time<br />
2a time<br />
3a time<br />
3b time<br />
4a time<br />
5a time<br />
6a time<br />
6b time<br />
6c time<br />
6d time<br />
7a time<br />
7b time<br />
7e time<br />
7d time<br />
8a time<br />
9a time<br />
9b time<br />
10a time<br />
10b time<br />
10c time<br />
11a time<br />
11b time<br />
12a time<br />
13a time<br />
13b time<br />
14a time<br />
14b time<br />
14c time<br />
14d time<br />
Ease to collect<br />
The time needed to collect and report the information is only one aspect <strong>of</strong> feasibility. Respondents<br />
may perceive the effort needed to fi nd the information differently. Therefore the respondents were<br />
asked whether they agreed or disagreed with the statement ‘The information is easy to fi nd’.<br />
There are two groups <strong>of</strong> indicators. The fi rst group comprises those indicators for which more<br />
than 60% <strong>of</strong> the respondents reported that they strongly agree with the statement. The second<br />
group comprises indicators where at least 20% <strong>of</strong> the respondents disagreed (strongly) with the<br />
statement.<br />
There is a signifi cant overlap between the lists <strong>of</strong> ‘feasible’ indicators <strong>of</strong> table 1 and table 2 and<br />
between the lists <strong>of</strong> less feasible indicators in both tables. The only exception is indicator 3b<br />
(pr<strong>of</strong>essional programs).<br />
Table 8: Opinions on the statement ‘information is easy to find’<br />
60% Strongly agree 20% disagree<br />
1a<br />
3b<br />
1b<br />
4a<br />
2a<br />
6c<br />
7e<br />
6d<br />
9a<br />
7d<br />
9b<br />
8a<br />
10a<br />
14b<br />
10b<br />
14c<br />
10c<br />
14d<br />
11a<br />
11b<br />
12<br />
MAPPING DIVERSITY


