

Mapping Diversity: Developing a European Classification of ... - U-Map
Mapping Diversity: Developing a European Classification of ... - U-Map
Mapping Diversity: Developing a European Classification of ... - U-Map

Create successful ePaper yourself
Turn your PDF publications into a flip-book with our unique Google optimized e-Paper software.
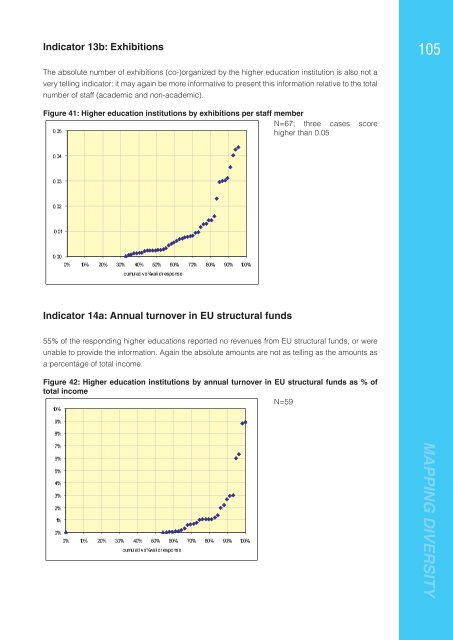
Indicator 13b: Exhibitions<br />
105<br />
The absolute number <strong>of</strong> exhibitions (co-)organized by the higher education institution is also not a<br />
very telling indicator: it may again be more informative to present this information relative to the total<br />
number <strong>of</strong> staff (academic and non-academic).<br />
Figure 41: Higher education institutions by exhibitions per staff member<br />
N=67; three cases score<br />
higher than 0.05<br />
0,05<br />
0,04<br />
0,03<br />
0,02<br />
0,01<br />
0,00<br />
0% 10% 20% 30% 40% 50% 60% 70% 80% 90% 100%<br />
cumulative %val i d r esponse<br />
Indicator 14a: Annual turnover in EU structural funds<br />
55% <strong>of</strong> the responding higher educations reported no revenues from EU structural funds, or were<br />
unable to provide the information. Again the absolute amounts are not as telling as the amounts as<br />
a percentage <strong>of</strong> total income.<br />
Figure 42: Higher education institutions by annual turnover in EU structural funds as % <strong>of</strong><br />
total income<br />
N=59<br />
10%<br />
9%<br />
7%<br />
6%<br />
5%<br />
4%<br />
3%<br />
2%<br />
1%<br />
0%<br />
40% 50% 60% 70% 80% 90% 100%<br />
0% 10% 20% 30%<br />
r esponse d i %val cumulative<br />
MAPPING DIVERSITY<br />
8%


