

Mapping Diversity: Developing a European Classification of ... - U-Map
Mapping Diversity: Developing a European Classification of ... - U-Map
Mapping Diversity: Developing a European Classification of ... - U-Map

Create successful ePaper yourself
Turn your PDF publications into a flip-book with our unique Google optimized e-Paper software.
doct<br />
er mast<br />
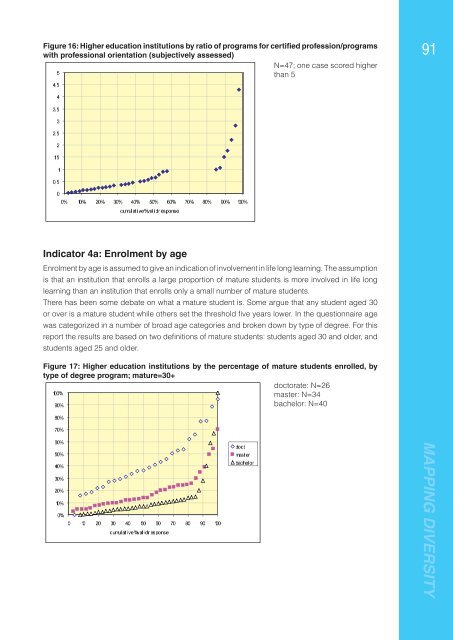
Figure 16: Higher education institutions by ratio <strong>of</strong> programs for certified pr<strong>of</strong>ession/programs<br />
with pr<strong>of</strong>essional orientation (subjectively assessed)<br />
N=47; one case scored higher<br />
than 5<br />
5<br />
91<br />
4,5<br />
4<br />
3,5<br />
3<br />
2,5<br />
2<br />
1,5<br />
1<br />
0,5<br />
0<br />
0% 10% 20% 30% 40% 50% 60% 70% 80% 90% 100%<br />
cumulative %val i d r esponse<br />
Indicator 4a: Enrolment by age<br />
Enrolment by age is assumed to give an indication <strong>of</strong> involvement in life long learning. The assumption<br />
is that an institution that enrolls a large proportion <strong>of</strong> mature students is more involved in life long<br />
learning than an institution that enrolls only a small number <strong>of</strong> mature students.<br />
There has been some debate on what a mature student is. Some argue that any student aged 30<br />
or over is a mature student while others set the threshold fi ve years lower. In the questionnaire age<br />
was categorized in a number <strong>of</strong> broad age categories and broken down by type <strong>of</strong> degree. For this<br />
report the results are based on two defi nitions <strong>of</strong> mature students: students aged 30 and older, and<br />
students aged 25 and older.<br />
Figure 17: Higher education institutions by the percentage <strong>of</strong> mature students enrolled, by<br />
type <strong>of</strong> degree program; mature=30+<br />
doctorate: N=26<br />
master: N=34<br />
100%<br />
bachelor: N=40<br />
90%<br />
80%<br />
70%<br />
60%<br />
50%<br />
40%<br />
30%<br />
20%<br />
10%<br />
0%<br />
0 10 20 30 40 50 60 70 80 90 100<br />
cumulative %val i d r esponse<br />
bachel or<br />
MAPPING DIVERSITY


