

Mapping Diversity: Developing a European Classification of ... - U-Map
Mapping Diversity: Developing a European Classification of ... - U-Map
Mapping Diversity: Developing a European Classification of ... - U-Map

Create successful ePaper yourself
Turn your PDF publications into a flip-book with our unique Google optimized e-Paper software.
er mast<br />
or bachel<br />
98<br />
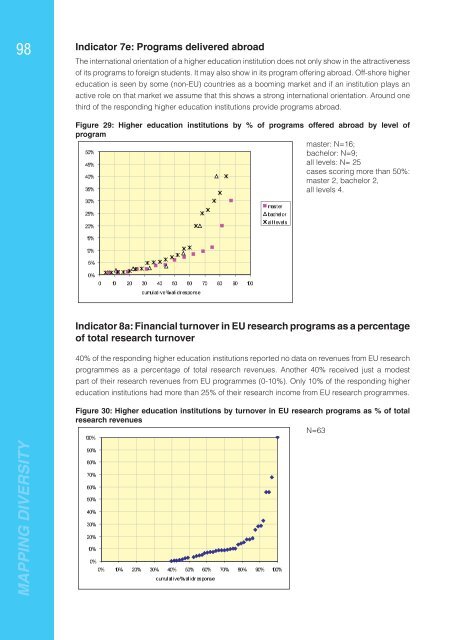
Indicator 7e: Programs delivered abroad<br />
The international orientation <strong>of</strong> a higher education institution does not only show in the attractiveness<br />
<strong>of</strong> its programs to foreign students. It may also show in its program <strong>of</strong>fering abroad. Off-shore higher<br />
education is seen by some (non-EU) countries as a booming market and if an institution plays an<br />
active role on that market we assume that this shows a strong international orientation. Around one<br />
third <strong>of</strong> the responding higher education institutions provide programs abroad.<br />
Figure 29: Higher education institutions by % <strong>of</strong> programs <strong>of</strong>fered abroad by level <strong>of</strong><br />
program<br />
master: N=16;<br />
bachelor: N=9;<br />
50%<br />
all levels: N= 45%<br />
25<br />
cases scoring more than 50%:<br />
40%<br />
master 2, bachelor 2,<br />
all levels 4.<br />
35%<br />
30%<br />
25%<br />
all levels<br />
20%<br />
15%<br />
10%<br />
5%<br />
0%<br />
0 10 20 30 40 50 60 70 80 90 100<br />
cumulative %val i d r esponse<br />
Indicator 8a: Financial turnover in EU research programs as a percentage<br />
<strong>of</strong> total research turnover<br />
40% <strong>of</strong> the responding higher education institutions reported no data on revenues from EU research<br />
programmes as a percentage <strong>of</strong> total research revenues. Another 40% received just a modest<br />
part <strong>of</strong> their research revenues from EU programmes (0-10%). Only 10% <strong>of</strong> the responding higher<br />
education institutions had more than 25% <strong>of</strong> their research income from EU research programmes.<br />
Figure 30: Higher education institutions by turnover in EU research programs as % <strong>of</strong> total<br />
research revenues<br />
N=63<br />
100%<br />
MAPPING DIVERSITY<br />
90%<br />
80%<br />
70%<br />
60%<br />
50%<br />
40%<br />
30%<br />
20%<br />
10%<br />
0%<br />
50% 60% 70% 80% 90% 100%<br />
0% 10% 20% 30% 40%<br />
esponse r d i %val cumulative


