

Mapping Diversity: Developing a European Classification of ... - U-Map
Mapping Diversity: Developing a European Classification of ... - U-Map
Mapping Diversity: Developing a European Classification of ... - U-Map

You also want an ePaper? Increase the reach of your titles
YUMPU automatically turns print PDFs into web optimized ePapers that Google loves.
doctorate<br />
er mast<br />
or bachel<br />
or +mast er<br />
bachel<br />
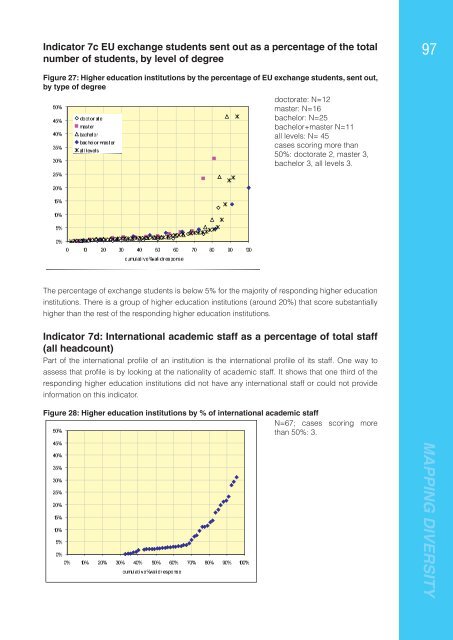
Indicator 7c EU exchange students sent out as a percentage <strong>of</strong> the total<br />
number <strong>of</strong> students, by level <strong>of</strong> degree<br />
97<br />
Figure 27: Higher education institutions by the percentage <strong>of</strong> EU exchange students, sent out,<br />
by type <strong>of</strong> degree<br />
50%<br />
45%<br />
40%<br />
35%<br />
30%<br />
all levels<br />
doctorate: N=12<br />
master: N=16<br />
bachelor: N=25<br />
bachelor+master N=11<br />
all levels: N= 45<br />
cases scoring more than<br />
50%: doctorate 2, master 3,<br />
bachelor 3, all levels 3.<br />
25%<br />
20%<br />
15%<br />
10%<br />
5%<br />
0%<br />
0 10 20 30 40 50 60 70 80 90 100<br />
cumulative %val i d r esponse<br />
The percentage <strong>of</strong> exchange students is below 5% for the majority <strong>of</strong> responding higher education<br />
institutions. There is a group <strong>of</strong> higher education institutions (around 20%) that score substantially<br />
higher than the rest <strong>of</strong> the responding higher education institutions.<br />
Indicator 7d: International academic staff as a percentage <strong>of</strong> total staff<br />
(all headcount)<br />
Part <strong>of</strong> the international pr<strong>of</strong>i le <strong>of</strong> an institution is the international pr<strong>of</strong>i le <strong>of</strong> its staff. One way to<br />
assess that pr<strong>of</strong>i le is by looking at the nationality <strong>of</strong> academic staff. It shows that one third <strong>of</strong> the<br />
responding higher education institutions did not have any international staff or could not provide<br />
information on this indicator.<br />
Figure 28: Higher education institutions by % <strong>of</strong> international academic staff<br />
N=67; cases scoring more<br />
than 50%: 3.<br />
50%<br />
45%<br />
40%<br />
35%<br />
30%<br />
25%<br />
20%<br />
15%<br />
10%<br />
5%<br />
0%<br />
50% 60% 70% 80% 90% 100%<br />
0% 10% 20% 30% 40%<br />
esponse r d i %val cumulative<br />
MAPPING DIVERSITY


