Mapping Diversity: Developing a European Classification of ... - U-Map
Mapping Diversity: Developing a European Classification of ... - U-Map
Mapping Diversity: Developing a European Classification of ... - U-Map
Create successful ePaper yourself
Turn your PDF publications into a flip-book with our unique Google optimized e-Paper software.
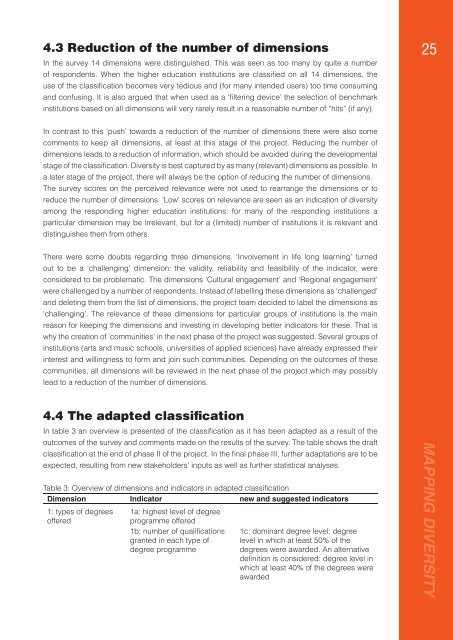
4.3 Reduction <strong>of</strong> the number <strong>of</strong> dimensions<br />
In the survey 14 dimensions were distinguished. This was seen as too many by quite a number<br />
<strong>of</strong> respondents. When the higher education institutions are classifi ed on all 14 dimensions, the<br />
use <strong>of</strong> the classifi cation becomes very tedious and (for many intended users) too time consuming<br />
and confusing. It is also argued that when used as a ‘fi ltering device’ the selection <strong>of</strong> benchmark<br />
institutions based on all dimensions will very rarely result in a reasonable number <strong>of</strong> “hits” (if any).<br />
25<br />
In contrast to this ‘push’ towards a reduction <strong>of</strong> the number <strong>of</strong> dimensions there were also some<br />
comments to keep all dimensions, at least at this stage <strong>of</strong> the project. Reducing the number <strong>of</strong><br />
dimensions leads to a reduction <strong>of</strong> information, which should be avoided during the developmental<br />
stage <strong>of</strong> the classifi cation. <strong>Diversity</strong> is best captured by as many (relevant) dimensions as possible. In<br />
a later stage <strong>of</strong> the project, there will always be the option <strong>of</strong> reducing the number <strong>of</strong> dimensions.<br />
The survey scores on the perceived relevance were not used to rearrange the dimensions or to<br />
reduce the number <strong>of</strong> dimensions. ’Low’ scores on relevance are seen as an indication <strong>of</strong> diversity<br />
among the responding higher education institutions: for many <strong>of</strong> the responding institutions a<br />
particular dimension may be irrelevant, but for a (limited) number <strong>of</strong> institutions it is relevant and<br />
distinguishes them from others.<br />
There were some doubts regarding three dimensions. ‘Involvement in life long learning’ turned<br />
out to be a ‘challenging’ dimension: the validity, reliability and feasibility <strong>of</strong> the indicator, were<br />
considered to be problematic. The dimensions ‘Cultural engagement’ and ‘Regional engagement’<br />
were challenged by a number <strong>of</strong> respondents. Instead <strong>of</strong> labelling these dimensions as ‘challenged’<br />
and deleting them from the list <strong>of</strong> dimensions, the project team decided to label the dimensions as<br />
‘challenging’. The relevance <strong>of</strong> these dimensions for particular groups <strong>of</strong> institutions is the main<br />
reason for keeping the dimensions and investing in developing better indicators for these. That is<br />
why the creation <strong>of</strong> ‘communities’ in the next phase <strong>of</strong> the project was suggested. Several groups <strong>of</strong><br />
institutions (arts and music schools, universities <strong>of</strong> applied sciences) have already expressed their<br />
interest and willingness to form and join such communities. Depending on the outcomes <strong>of</strong> these<br />
communities, all dimensions will be reviewed in the next phase <strong>of</strong> the project which may possibly<br />
lead to a reduction <strong>of</strong> the number <strong>of</strong> dimensions.<br />
4.4 The adapted classification<br />
In table 3 an overview is presented <strong>of</strong> the classifi cation as it has been adapted as a result <strong>of</strong> the<br />
outcomes <strong>of</strong> the survey and comments made on the results <strong>of</strong> the survey. The table shows the draft<br />
classifi cation at the end <strong>of</strong> phase II <strong>of</strong> the project. In the fi nal phase III, further adaptations are to be<br />
expected, resulting from new stakeholders’ inputs as well as further statistical analyses.<br />
Table 3: Overview <strong>of</strong> dimensions and indicators in adapted classifi cation<br />
Dimension Indicator new and suggested indicators<br />
1: types <strong>of</strong> degrees<br />
<strong>of</strong>fered<br />
1a: highest level <strong>of</strong> degree<br />
programme <strong>of</strong>fered<br />
1b: number <strong>of</strong> qualifi cations<br />
granted in each type <strong>of</strong><br />
degree programme<br />
1c: dominant degree level: degree<br />
level in which at least 50% <strong>of</strong> the<br />
degrees were awarded. An alternative<br />
defi nition is considered: degree level in<br />
which at least 40% <strong>of</strong> the degrees were<br />
awarded<br />
MAPPING DIVERSITY


