

Mapping Diversity: Developing a European Classification of ... - U-Map
Mapping Diversity: Developing a European Classification of ... - U-Map
Mapping Diversity: Developing a European Classification of ... - U-Map

You also want an ePaper? Increase the reach of your titles
YUMPU automatically turns print PDFs into web optimized ePapers that Google loves.
ate (3r d<br />
doctor<br />
cycle)<br />
or (1st bachel<br />
cycle)<br />
Results<br />
87<br />
Indicator 1a: Highest level <strong>of</strong> degree <strong>of</strong>fered<br />
In the questionnaire, four levels <strong>of</strong> degree programs were specifi ed:<br />
• doctor or equivalent third cycle degree programs;<br />
• master or equivalent second cycle degree programs;<br />
• bachelor or equivalent fi rst cycle degree programs;<br />
• other levels <strong>of</strong> degree programs.<br />
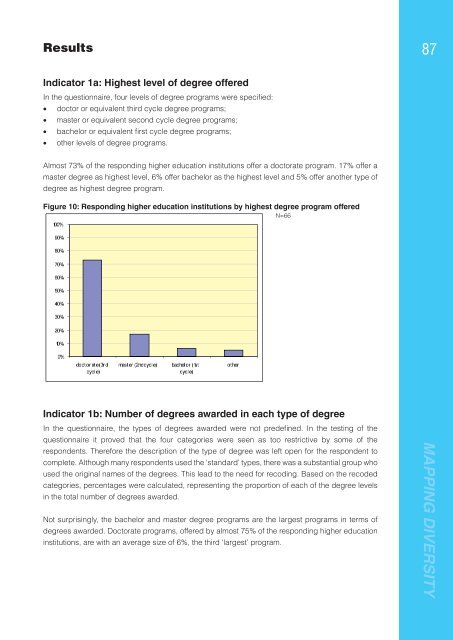
Almost 73% <strong>of</strong> the responding higher education institutions <strong>of</strong>fer a doctorate program. 17% <strong>of</strong>fer a<br />
master degree as highest level, 6% <strong>of</strong>fer bachelor as the highest level and 5% <strong>of</strong>fer another type <strong>of</strong><br />
degree as highest degree program.<br />
Figure 10: Responding higher education institutions by highest degree program <strong>of</strong>fered<br />
N=66<br />
100%<br />
90%<br />
80%<br />
70%<br />
60%<br />
50%<br />
40%<br />
30%<br />
20%<br />
10%<br />
0%<br />
other<br />
master (2nd cycl e)<br />
Indicator 1b: Number <strong>of</strong> degrees awarded in each type <strong>of</strong> degree<br />
In the questionnaire, the types <strong>of</strong> degrees awarded were not predefi ned. In the testing <strong>of</strong> the<br />
questionnaire it proved that the four categories were seen as too restrictive by some <strong>of</strong> the<br />
respondents. Therefore the description <strong>of</strong> the type <strong>of</strong> degree was left open for the respondent to<br />
complete. Although many respondents used the ‘standard’ types, there was a substantial group who<br />
used the original names <strong>of</strong> the degrees. This lead to the need for recoding. Based on the recoded<br />
categories, percentages were calculated, representing the proportion <strong>of</strong> each <strong>of</strong> the degree levels<br />
in the total number <strong>of</strong> degrees awarded.<br />
Not surprisingly, the bachelor and master degree programs are the largest programs in terms <strong>of</strong><br />
degrees awarded. Doctorate programs, <strong>of</strong>fered by almost 75% <strong>of</strong> the responding higher education<br />
institutions, are with an average size <strong>of</strong> 6%, the third ‘largest’ program.<br />
MAPPING DIVERSITY


