

Mapping Diversity: Developing a European Classification of ... - U-Map
Mapping Diversity: Developing a European Classification of ... - U-Map
Mapping Diversity: Developing a European Classification of ... - U-Map

You also want an ePaper? Increase the reach of your titles
YUMPU automatically turns print PDFs into web optimized ePapers that Google loves.
doct<br />
er mast<br />
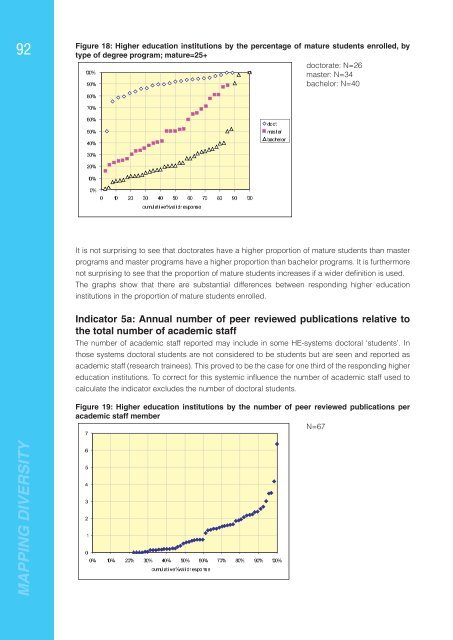
Figure 18: Higher education institutions by the percentage <strong>of</strong> mature students enrolled, by<br />
92<br />
type <strong>of</strong> degree program; mature=25+<br />
doctorate: N=26<br />
master: N=34<br />
100%<br />
bachelor: N=40<br />
90%<br />
80%<br />
70%<br />
60%<br />
50%<br />
bachel or<br />
40%<br />
30%<br />
20%<br />
10%<br />
0%<br />
0 10 20 30 40 50 60 70 80 90 100<br />
cumulative %val i d r esponse<br />
It is not surprising to see that doctorates have a higher proportion <strong>of</strong> mature students than master<br />
programs and master programs have a higher proportion than bachelor programs. It is furthermore<br />
not surprising to see that the proportion <strong>of</strong> mature students increases if a wider defi nition is used.<br />
The graphs show that there are substantial differences between responding higher education<br />
institutions in the proportion <strong>of</strong> mature students enrolled.<br />
Indicator 5a: Annual number <strong>of</strong> peer reviewed publications relative to<br />
the total number <strong>of</strong> academic staff<br />
The number <strong>of</strong> academic staff reported may include in some HE-systems doctoral ‘students’. In<br />
those systems doctoral students are not considered to be students but are seen and reported as<br />
academic staff (research trainees). This proved to be the case for one third <strong>of</strong> the responding higher<br />
education institutions. To correct for this systemic infl uence the number <strong>of</strong> academic staff used to<br />
calculate the indicator excludes the number <strong>of</strong> doctoral students.<br />
Figure 19: Higher education institutions by the number <strong>of</strong> peer reviewed publications per<br />
academic staff member<br />
N=67<br />
7<br />
MAPPING DIVERSITY<br />
6<br />
5<br />
4<br />
3<br />
2<br />
1<br />
0<br />
40% 50% 60% 70% 80% 90% 100%<br />
0% 10% 20% 30%<br />
r esponse d i %val cumulative


