

Mapping Diversity: Developing a European Classification of ... - U-Map
Mapping Diversity: Developing a European Classification of ... - U-Map
Mapping Diversity: Developing a European Classification of ... - U-Map

You also want an ePaper? Increase the reach of your titles
YUMPU automatically turns print PDFs into web optimized ePapers that Google loves.
76 Validity <strong>of</strong> indicators<br />
For each <strong>of</strong> the 14 dimensions one or more indicators have been selected. The scores on these<br />
indicators have to convey a correct or at least plausible picture <strong>of</strong> the dimension they belong to. This<br />
validity is assessed by a question in the dimensions-questionnaire. The higher education institutions<br />
were asked to give their opinion regarding the statement: ‘indicator a is a valid indicator for this<br />
dimension’.<br />
The average perception <strong>of</strong> the validity <strong>of</strong> the indicators varied substantially between indicators. For<br />
eight indicators less than 15% <strong>of</strong> the responding higher education institutions (strongly) disagreed<br />
with the statement that the indicator was a valid one. For 12 indicators the respondents have some<br />
doubts regarding the validity: between 30% and 50% <strong>of</strong> the responding higher education institutions<br />
indicated that they did not consider those indicators to be valid indicators (within the dimension they<br />
are presented in).<br />
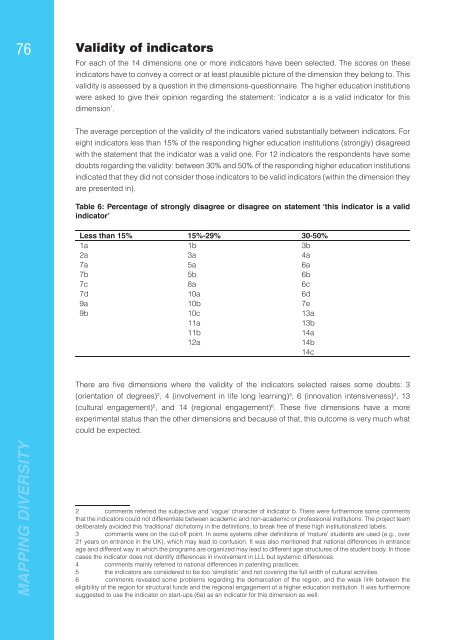
Table 6: Percentage <strong>of</strong> strongly disagree or disagree on statement ‘this indicator is a valid<br />
indicator’<br />
Less than 15% 15%-29% 30-50%<br />
1a 1b 3b<br />
2a 3a 4a<br />
7a 5a 6a<br />
7b 5b 6b<br />
7c 8a 6c<br />
7d 10a 6d<br />
9a 10b 7e<br />
9b 10c 13a<br />
11a<br />
13b<br />
11b<br />
14a<br />
12a<br />
14b<br />
14c<br />
There are fi ve dimensions where the validity <strong>of</strong> the indicators selected raises some doubts: 3<br />
(orientation <strong>of</strong> degrees) 2 , 4 (involvement in life long learning) 3 , 6 (innovation intensiveness) 4 , 13<br />
(cultural engagement) 5 , and 14 (regional engagement) 6 . These fi ve dimensions have a more<br />
experimental status than the other dimensions and because <strong>of</strong> that, this outcome is very much what<br />
could be expected.<br />
MAPPING DIVERSITY<br />
2 comments referred the subjective and ‘vague’ character <strong>of</strong> indicator b. There were furthermore some comments<br />
that the indicators could not differentiate between academic and non-academic or pr<strong>of</strong>essional institutions. The project team<br />
deliberately avoided this ‘traditional’ dichotomy in the defi nitions, to break free <strong>of</strong> these high institutionalized labels.<br />
3 comments were on the cut-<strong>of</strong>f point. In some systems other defi nitions <strong>of</strong> ‘mature’ students are used (e.g., over<br />
21 years on entrance in the UK), which may lead to confusion. It was also mentioned that national differences in entrance<br />
age and different way in which the programs are organized may lead to different age structures <strong>of</strong> the student body. In those<br />
cases the indicator does not identify differences in involvement in LLL but systemic differences.<br />
4 comments mainly referred to national differences in patenting practices.<br />
5 the indicators are considered to be too ‘simplistic’ and not covering the full width <strong>of</strong> cultural activities.<br />
6 comments revealed some problems regarding the demarcation <strong>of</strong> the region, and the weak link between the<br />
eligibility <strong>of</strong> the region for structural funds and the regional engagement <strong>of</strong> a higher education institution. It was furthermore<br />
suggested to use the indicator on start-ups (6a) as an indicator for this dimension as well.


