

Mapping Diversity: Developing a European Classification of ... - U-Map
Mapping Diversity: Developing a European Classification of ... - U-Map
Mapping Diversity: Developing a European Classification of ... - U-Map

Create successful ePaper yourself
Turn your PDF publications into a flip-book with our unique Google optimized e-Paper software.
Pr opor ti on <strong>of</strong><br />
3a:<br />
ogr ammes l eadi ng to<br />
pr<br />
ti f i ed pr <strong>of</strong> essi ons<br />
cer<br />
Subjecti ve assessment<br />
3b:<br />
pr opor ti on pr <strong>of</strong> essi onal<br />
<strong>of</strong><br />
i ented pr ogr ammes<br />
or<br />
90<br />
Indicator 3a and 3b: Orientation <strong>of</strong> programs<br />
The third dimension (orientation <strong>of</strong> degrees) comprises two indicators: an ‘objective’ indicator – the<br />
number <strong>of</strong> programs leading to a certifi ed or regulated degree – and a subjective assessment <strong>of</strong><br />
the pr<strong>of</strong>essional orientation <strong>of</strong> the degrees <strong>of</strong>fered. The concept <strong>of</strong> the orientation <strong>of</strong> degrees proved<br />
to be diffi cult to capture. In the early versions <strong>of</strong> the list <strong>of</strong> indicators various formulations were<br />
used, but there was neither a comprehensive and acceptable statistic to be found nor a generally<br />
acceptable qualitative indicator. In the fi nal questionnaire, both a more objective and a subjective<br />
indicator were included. If the results on both indicators prove to be consistent, the combined<br />
indicator may be continued to be used to convey an indication <strong>of</strong> the orientation <strong>of</strong> the programs. If<br />
not, the choice <strong>of</strong> indicators needs to be reconsidered.<br />
The objective indicator is the percentage <strong>of</strong> programs leading to certifi ed/regulated pr<strong>of</strong>essions.<br />
It is quite remarkable that one out <strong>of</strong> every six higher education institutions only provides programs<br />
that lead to regulated pr<strong>of</strong>essions. On average the percentage is 39%.<br />
The subjective assessment <strong>of</strong> the proportion <strong>of</strong> pr<strong>of</strong>essional oriented programs leads to a higher<br />
score: the average score is 56%.<br />
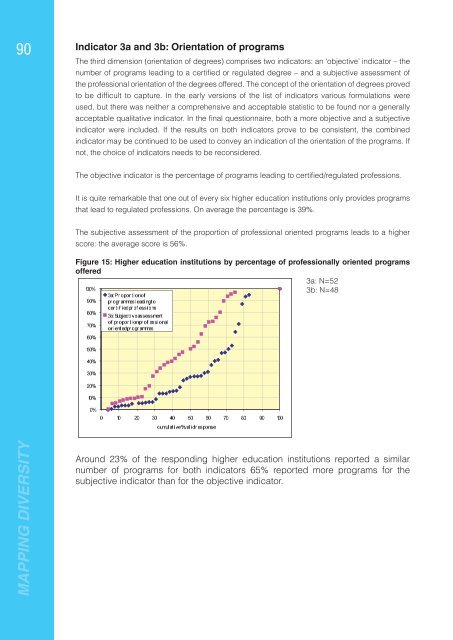
Figure 15: Higher education institutions by percentage <strong>of</strong> pr<strong>of</strong>essionally oriented programs<br />
<strong>of</strong>fered<br />
3a: N=52<br />
3b: N=48<br />
100%<br />
90%<br />
80%<br />
70%<br />
60%<br />
50%<br />
40%<br />
30%<br />
20%<br />
10%<br />
0%<br />
0 10 20 30 40 50 60 70 80 90 100<br />
cumulative %val i d r esponse<br />
MAPPING DIVERSITY<br />
Around 23% <strong>of</strong> the responding higher education institutions reported a similar<br />
number <strong>of</strong> programs for both indicators 65% reported more programs for the<br />
subjective indicator than for the objective indicator.


