

Mapping Diversity: Developing a European Classification of ... - U-Map
Mapping Diversity: Developing a European Classification of ... - U-Map
Mapping Diversity: Developing a European Classification of ... - U-Map

You also want an ePaper? Increase the reach of your titles
YUMPU automatically turns print PDFs into web optimized ePapers that Google loves.
Valid cases<br />
The fourth indication <strong>of</strong> the feasibility <strong>of</strong> data collection is not derived from a question in the<br />
‘assessment’ part <strong>of</strong> the questionnaire. This indication, the percentage <strong>of</strong> valid responses, builds on<br />
‘the pro<strong>of</strong> <strong>of</strong> the pudding is in its eating!’ If many responding higher education institutions have been<br />
able to provide valid responses for an indicator, we assume that this is an indication that collecting<br />
the data on that indicator is highly feasible. A low valid response points at low feasibility. For a<br />
number <strong>of</strong> indicators it proved impossible to distinguish invalid responses from a ‘0’-response.<br />
85<br />
Table 10: Percentage <strong>of</strong> valid responses, by indicator<br />
50%-75% Less than 50%<br />
4a<br />
7e<br />
6d<br />
10a<br />
10c<br />
10b<br />
The remaining indicators had a score higher than 75%.<br />
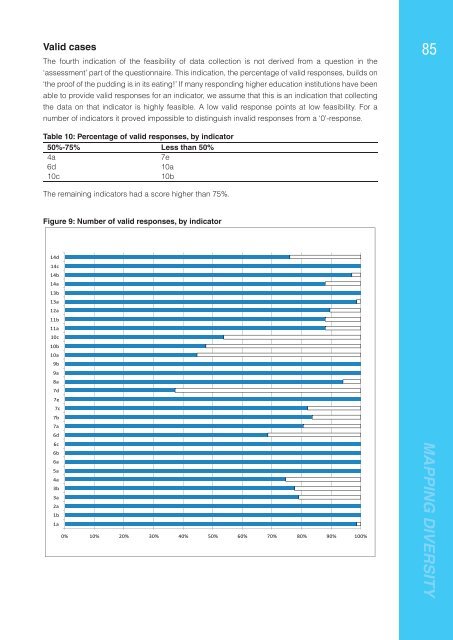
Figure 9: Number <strong>of</strong> valid responses, by indicator<br />
14d<br />
14c<br />
14b<br />
14a<br />
13b<br />
13a<br />
12a<br />
11b<br />
11a<br />
10c<br />
10b<br />
10a<br />
9b<br />
9a<br />
8a<br />
7d<br />
7e<br />
7c<br />
7b<br />
7a<br />
6d<br />
6c<br />
6b<br />
6a<br />
5a<br />
4a<br />
3b<br />
3a<br />
2a<br />
1b<br />
1a<br />
0% 10% 20% 30% 40% 50% 60% 70% 80% 90% 100%<br />
MAPPING DIVERSITY


