

Mapping Diversity: Developing a European Classification of ... - U-Map
Mapping Diversity: Developing a European Classification of ... - U-Map
Mapping Diversity: Developing a European Classification of ... - U-Map

Create successful ePaper yourself
Turn your PDF publications into a flip-book with our unique Google optimized e-Paper software.
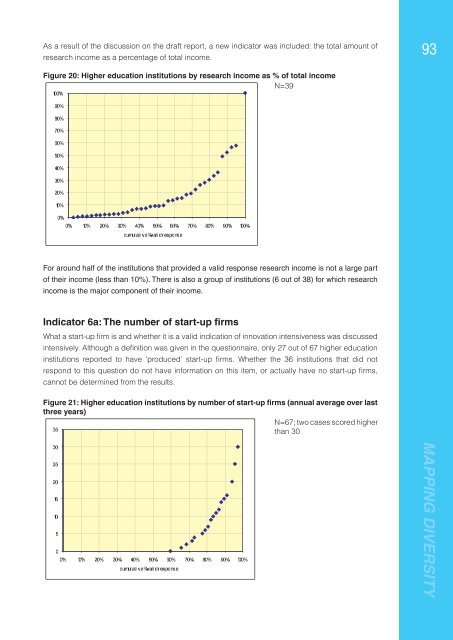
As a result <strong>of</strong> the discussion on the draft report, a new indicator was included: the total amount <strong>of</strong><br />
research income as a percentage <strong>of</strong> total income.<br />
93<br />
Figure 20: Higher education institutions by research income as % <strong>of</strong> total income<br />
N=39<br />
100%<br />
90%<br />
80%<br />
70%<br />
60%<br />
50%<br />
40%<br />
30%<br />
20%<br />
10%<br />
0%<br />
0% 10% 20% 30% 40% 50% 60% 70% 80% 90% 100%<br />
cumulative %val i d r esponse<br />
For around half <strong>of</strong> the institutions that provided a valid response research income is not a large part<br />
<strong>of</strong> their income (less than 10%). There is also a group <strong>of</strong> institutions (6 out <strong>of</strong> 38) for which research<br />
income is the major component <strong>of</strong> their income.<br />
Indicator 6a: The number <strong>of</strong> start-up firms<br />
What a start-up fi rm is and whether it is a valid indication <strong>of</strong> innovation intensiveness was discussed<br />
intensively. Although a defi nition was given in the questionnaire, only 27 out <strong>of</strong> 67 higher education<br />
institutions reported to have ‘produced’ start-up fi rms. Whether the 36 institutions that did not<br />
respond to this question do not have information on this item, or actually have no start-up fi rms,<br />
cannot be determined from the results.<br />
Figure 21: Higher education institutions by number <strong>of</strong> start-up firms (annual average over last<br />
three years)<br />
N=67; two cases scored higher<br />
than 30<br />
35<br />
30<br />
25<br />
20<br />
15<br />
10<br />
5<br />
0<br />
40% 50% 60% 70% 80% 90% 100%<br />
0% 10% 20% 30%<br />
r esponse d i %val cumulative<br />
MAPPING DIVERSITY


