Understanding the Public Services Industy
Understanding the Public Services Industy
Understanding the Public Services Industy
You also want an ePaper? Increase the reach of your titles
YUMPU automatically turns print PDFs into web optimized ePapers that Google loves.
<strong>Public</strong> <strong>Services</strong> Industry Review<br />
How are <strong>Public</strong> <strong>Services</strong> Financed?<br />
1.6 The financing of public services varies significantly from country to country. Possible<br />
options include:<br />
•<br />
•<br />
•<br />
100 per cent taxpayer financed (‘free at <strong>the</strong> point of delivery’)<br />
Partially user financed e.g. higher education<br />
Means tested financing e.g. social care<br />
1.7 The choice of financing is independent of <strong>the</strong> choices around how <strong>the</strong> service is<br />
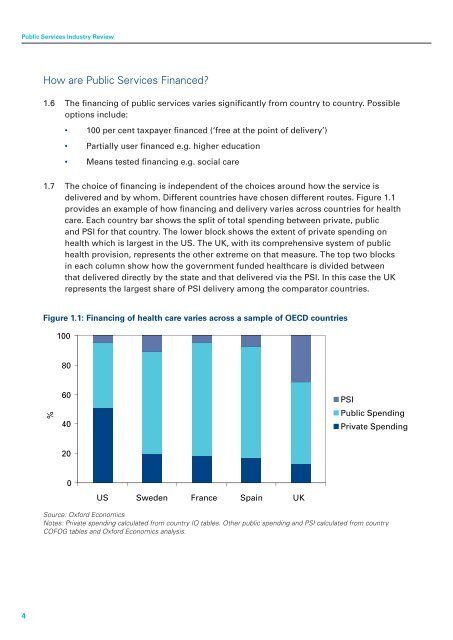
delivered and by whom. Different countries have chosen different routes. Figure 1.1<br />
provides an example of how financing and delivery varies across countries for health<br />
care. Each country bar shows <strong>the</strong> split of total spending between private, public<br />
and PSI for that country. The lower block shows <strong>the</strong> extent of private spending on<br />
health which is largest in <strong>the</strong> US. The UK, with its comprehensive system of public<br />
health provision, represents <strong>the</strong> o<strong>the</strong>r extreme on that measure. The top two blocks<br />
in each column show how <strong>the</strong> government funded healthcare is divided between<br />
that delivered directly by <strong>the</strong> state and that delivered via <strong>the</strong> PSI. In this case <strong>the</strong> UK<br />
represents <strong>the</strong> largest share of PSI delivery among <strong>the</strong> comparator countries.<br />
Figure 1.1: Financing of health care varies across a sample of OECD countries<br />
100<br />
80<br />
%<br />
60<br />
40<br />
PSI<br />
<strong>Public</strong> Spending<br />
Private Spending<br />
20<br />
0<br />
US Sweden France Spain UK<br />
Source: Oxford Economics<br />
Notes: Private spending calculated from country IO tables. O<strong>the</strong>r public spending and PSI calculated from country<br />
COFOG tables and Oxford Economics analysis.<br />
4


