Understanding the Public Services Industy
Understanding the Public Services Industy
Understanding the Public Services Industy

Create successful ePaper yourself
Turn your PDF publications into a flip-book with our unique Google optimized e-Paper software.
<strong>Public</strong> <strong>Services</strong> Industry Review<br />
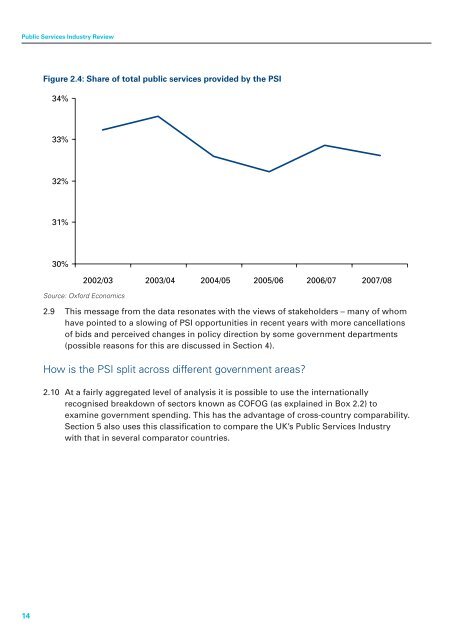
Figure 2.4: Share of total public services provided by <strong>the</strong> PSI<br />
34%<br />
33%<br />
32%<br />
31%<br />
30%<br />
2002/03 2003/04 2004/05 2005/06 2006/07 2007/08<br />
Source: Oxford Economics<br />
2.9 This message from <strong>the</strong> data resonates with <strong>the</strong> views of stakeholders – many of whom<br />
have pointed to a slowing of PSI opportunities in recent years with more cancellations<br />
of bids and perceived changes in policy direction by some government departments<br />
(possible reasons for this are discussed in Section 4).<br />
How is <strong>the</strong> PSI split across different government areas?<br />
2.10 At a fairly aggregated level of analysis it is possible to use <strong>the</strong> internationally<br />
recognised breakdown of sectors known as COFOG (as explained in Box 2.2) to<br />
examine government spending. This has <strong>the</strong> advantage of cross-country comparability.<br />
Section 5 also uses this classification to compare <strong>the</strong> UK’s <strong>Public</strong> <strong>Services</strong> Industry<br />
with that in several comparator countries.<br />
14