Understanding the Public Services Industy
Understanding the Public Services Industy
Understanding the Public Services Industy

You also want an ePaper? Increase the reach of your titles
YUMPU automatically turns print PDFs into web optimized ePapers that Google loves.
<strong>Public</strong> <strong>Services</strong> Industry Review<br />
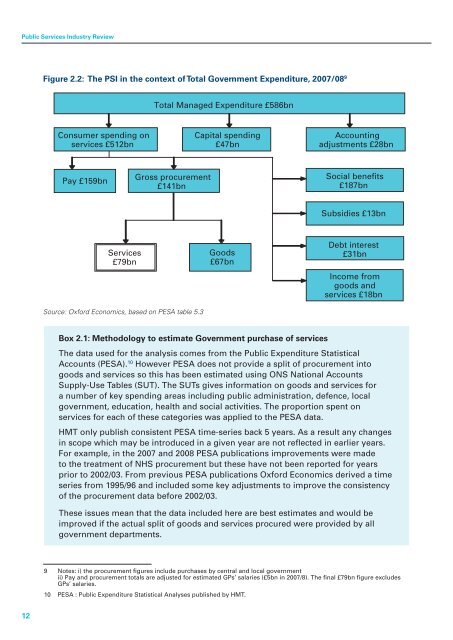
Figure 2.2: The PSI in <strong>the</strong> context of Total Government Expenditure, 2007/08 9<br />
Total Managed Expenditure £586bn<br />
Consumer spending on<br />
services £512bn<br />
Capital spending<br />
£47bn<br />
Accounting<br />
adjustments £28bn<br />
Pay £159bn<br />
Gross procurement<br />
£141bn<br />
Social benefits<br />
£187bn<br />
Subsidies £13bn<br />
<strong>Services</strong><br />
£79bn<br />
Source: Oxford Economics, based on PESA table 5.3<br />
Goods<br />
£67bn<br />
Debt interest<br />
£31bn<br />
Income from<br />
goods and<br />
services £18bn<br />
Box 2.1: Methodology to estimate Government purchase of services<br />
The data used for <strong>the</strong> analysis comes from <strong>the</strong> <strong>Public</strong> Expenditure Statistical<br />
Accounts (PESA). 10 However PESA does not provide a split of procurement into<br />
goods and services so this has been estimated using ONS National Accounts<br />
Supply-Use Tables (SUT). The SUTs gives information on goods and services for<br />
a number of key spending areas including public administration, defence, local<br />
government, education, health and social activities. The proportion spent on<br />
services for each of <strong>the</strong>se categories was applied to <strong>the</strong> PESA data.<br />
HMT only publish consistent PESA time-series back 5 years. As a result any changes<br />
in scope which may be introduced in a given year are not reflected in earlier years.<br />
For example, in <strong>the</strong> 2007 and 2008 PESA publications improvements were made<br />
to <strong>the</strong> treatment of NHS procurement but <strong>the</strong>se have not been reported for years<br />
prior to 2002/03. From previous PESA publications Oxford Economics derived a time<br />
series from 1995/96 and included some key adjustments to improve <strong>the</strong> consistency<br />
of <strong>the</strong> procurement data before 2002/03.<br />
These issues mean that <strong>the</strong> data included here are best estimates and would be<br />
improved if <strong>the</strong> actual split of goods and services procured were provided by all<br />
government departments.<br />
9 Notes: i) <strong>the</strong> procurement figures include purchases by central and local government<br />
ii) Pay and procurement totals are adjusted for estimated GPs’ salaries (£5bn in 2007/8). The final £79bn figure excludes<br />
GPs’ salaries.<br />
10 PESA : <strong>Public</strong> Expenditure Statistical Analyses published by HMT.<br />
12