Understanding the Public Services Industy
Understanding the Public Services Industy
Understanding the Public Services Industy

You also want an ePaper? Increase the reach of your titles
YUMPU automatically turns print PDFs into web optimized ePapers that Google loves.
<strong>Public</strong> <strong>Services</strong> Industry Review<br />
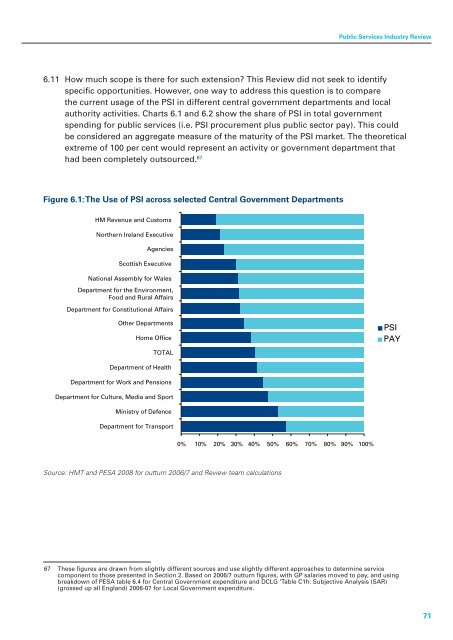
6.11 How much scope is <strong>the</strong>re for such extension? This Review did not seek to identify<br />
specific opportunities. However, one way to address this question is to compare<br />
<strong>the</strong> current usage of <strong>the</strong> PSI in different central government departments and local<br />
authority activities. Charts 6.1 and 6.2 show <strong>the</strong> share of PSI in total government<br />
spending for public services (i.e. PSI procurement plus public sector pay). This could<br />
be considered an aggregate measure of <strong>the</strong> maturity of <strong>the</strong> PSI market. The <strong>the</strong>oretical<br />
extreme of 100 per cent would represent an activity or government department that<br />
had been completely outsourced. 67<br />
Figure 6.1: The Use of PSI across selected Central Government Departments<br />
HM Revenue and Customs<br />
Nor<strong>the</strong>rn Ireland Executive<br />
Agencies<br />
Scottish Executive<br />
National Assembly for Wales<br />
Department for <strong>the</strong> Environment,<br />
Food and Rural Affairs<br />
Department for Constitutional Affairs<br />
O<strong>the</strong>r Departments<br />
Home Office<br />
PSI<br />
PAY<br />
TOTAL<br />
Department of Health<br />
Department for Work and Pensions<br />
Department for Culture, Media and Sport<br />
Ministry of Defence<br />
Department for Transport<br />
0% 10% 20% 30% 40% 50% 60% 70% 80% 90% 100%<br />
Source: HMT and PESA 2008 for outturn 2006/7 and review team calculations<br />
67 These figures are drawn from slightly different sources and use slightly different approaches to determine service<br />
component to those presented in Section 2. Based on 2006/7 outturn figures, with GP salaries moved to pay, and using<br />
breakdown of PESA table 6.4 for Central Government expenditure and DCLG ‘Table C1h: Subjective Analysis (SAR)<br />
(grossed up all England) 2006-07 for Local Government expenditure.<br />
71