Understanding the Public Services Industy
Understanding the Public Services Industy
Understanding the Public Services Industy

You also want an ePaper? Increase the reach of your titles
YUMPU automatically turns print PDFs into web optimized ePapers that Google loves.
<strong>Public</strong> <strong>Services</strong> Industry Review<br />
•<br />
•<br />
•<br />
UK companies like Serco and VT Group have used experience and skills acquired<br />
through operating in <strong>the</strong> UK PSI to become successful international businesses.<br />
American prison management companies dominated <strong>the</strong> first generation of<br />
prison contracts in Australia and <strong>the</strong> UK.<br />
Australian companies have used that country’s lead in PPP toll roads to become<br />
major international players in <strong>the</strong> PPP roads market.<br />
5.5 Companies interviewed during this Review repeatedly highlighted <strong>the</strong> importance of<br />
<strong>the</strong> UK government continuing to develop innovative ways of working with <strong>the</strong> private<br />
and third sectors as a driver for international business. O<strong>the</strong>r countries have looked<br />
to <strong>the</strong> UK to learn lessons from our use of PPP and PFI. Partnerships UK, for example,<br />
frequently meet overseas representatives to discuss how <strong>the</strong> UK model can be applied<br />
elsewhere. There are also many advisory and finance firms who gained experience<br />
supporting PPPs and PFIs in <strong>the</strong> UK and who now generate significant export revenue<br />
from applying those skills abroad.<br />
How does <strong>the</strong> PSI in <strong>the</strong> UK compare to that in o<strong>the</strong>r OECD countries? 64<br />
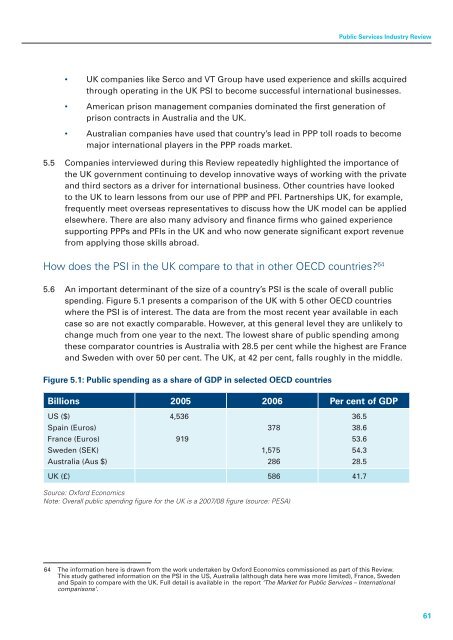
5.6 An important determinant of <strong>the</strong> size of a country’s PSI is <strong>the</strong> scale of overall public<br />
spending. Figure 5.1 presents a comparison of <strong>the</strong> UK with 5 o<strong>the</strong>r OECD countries<br />
where <strong>the</strong> PSI is of interest. The data are from <strong>the</strong> most recent year available in each<br />
case so are not exactly comparable. However, at this general level <strong>the</strong>y are unlikely to<br />
change much from one year to <strong>the</strong> next. The lowest share of public spending among<br />
<strong>the</strong>se comparator countries is Australia with 28.5 per cent while <strong>the</strong> highest are France<br />
and Sweden with over 50 per cent. The UK, at 42 per cent, falls roughly in <strong>the</strong> middle.<br />
Figure 5.1: <strong>Public</strong> spending as a share of GDP in selected OECD countries<br />
Billions 2005 2006 Per cent of GDP<br />
US ($)<br />
Spain (Euros)<br />
France (Euros)<br />
Sweden (SEK)<br />
Australia (Aus $)<br />
4,536<br />
919<br />
378<br />
1,575<br />
286<br />
36.5<br />
38.6<br />
53.6<br />
54.3<br />
28.5<br />
UK (£) 586 41.7<br />
Source: Oxford Economics<br />
Note: Overall public spending figure for <strong>the</strong> UK is a 2007/08 figure (source: PESA)<br />
64 The information here is drawn from <strong>the</strong> work undertaken by Oxford Economics commissioned as part of this Review.<br />
This study ga<strong>the</strong>red information on <strong>the</strong> PSI in <strong>the</strong> US, Australia (although data here was more limited), France, Sweden<br />
and Spain to compare with <strong>the</strong> UK. Full detail is available in <strong>the</strong> report ‘The Market for <strong>Public</strong> <strong>Services</strong> – International<br />
comparisons’.<br />
61