Understanding the Public Services Industy
Understanding the Public Services Industy
Understanding the Public Services Industy

You also want an ePaper? Increase the reach of your titles
YUMPU automatically turns print PDFs into web optimized ePapers that Google loves.
<strong>Public</strong> <strong>Services</strong> Industry Review<br />
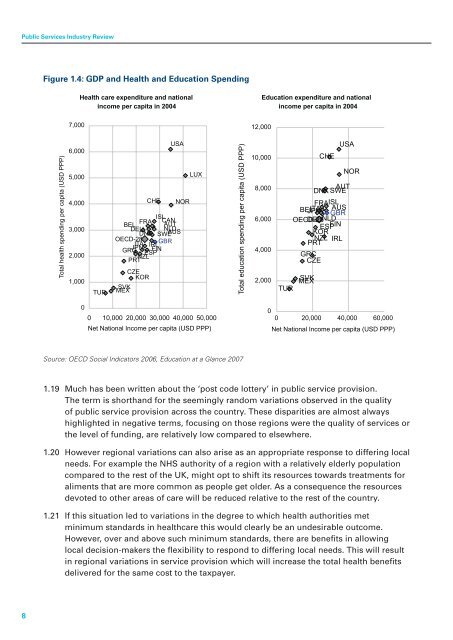
Figure 1.4: GDP and Health and Education Spending<br />
Health care expenditure and national<br />
income per capita in 2004<br />
Education expenditure and national<br />
income per capita in 2004<br />
7,000<br />
12,000<br />
Total health spending per capita (USD PPP)<br />
6,000<br />
5,000<br />
4,000<br />
3,000<br />
2,000<br />
1,000<br />
TUR<br />
USA<br />
LUX<br />
CHE NOR<br />
ISL<br />
CAN<br />
BEL<br />
FRA<br />
AUT<br />
DEU NLD<br />
DNK SWEAUS<br />
OECD-28<br />
ITA<br />
GBR<br />
IRL<br />
GRC<br />
JPN FIN<br />
ESP<br />
NZL<br />
PRT<br />
CZE<br />
KOR<br />
SVK<br />
MEX<br />
Total health spending per capita (USD PPP)<br />
1<br />
1<br />
1<br />
1<br />
Total education spending per capita (USD PPP)<br />
70 75<br />
10,000<br />
8,000<br />
6,000<br />
4,000<br />
2,000<br />
USA<br />
CHE<br />
NOR<br />
AUT<br />
DNK SWE<br />
FRAISL<br />
BEL JPN ITA AUS<br />
GBR<br />
OECD-28 DEUNLD<br />
ESPFIN<br />
KOR<br />
NZL IRL<br />
PRT<br />
GRC<br />
CZE<br />
MEX<br />
SVK<br />
TUR<br />
0<br />
0 10,000 20,000 30,000 40,000 50,000<br />
Net National Income per capita (USD PPP)<br />
0<br />
0<br />
0 20,000 40,000 60,000<br />
Net National Income per capita (USD PPP)<br />
Source: OECD Social Indicators 2006, Education at a Glance 2007<br />
1.19 Much has been written about <strong>the</strong> ‘post code lottery’ in public service provision.<br />
The term is shorthand for <strong>the</strong> seemingly random variations observed in <strong>the</strong> quality<br />
of public service provision across <strong>the</strong> country. These disparities are almost always<br />
highlighted in negative terms, focusing on those regions were <strong>the</strong> quality of services or<br />
<strong>the</strong> level of funding, are relatively low compared to elsewhere.<br />
1.20 However regional variations can also arise as an appropriate response to differing local<br />
needs. For example <strong>the</strong> NHS authority of a region with a relatively elderly population<br />
compared to <strong>the</strong> rest of <strong>the</strong> UK, might opt to shift its resources towards treatments for<br />
aliments that are more common as people get older. As a consequence <strong>the</strong> resources<br />
devoted to o<strong>the</strong>r areas of care will be reduced relative to <strong>the</strong> rest of <strong>the</strong> country.<br />
1.21 If this situation led to variations in <strong>the</strong> degree to which health authorities met<br />
minimum standards in healthcare this would clearly be an undesirable outcome.<br />
However, over and above such minimum standards, <strong>the</strong>re are benefits in allowing<br />
local decision-makers <strong>the</strong> flexibility to respond to differing local needs. This will result<br />
in regional variations in service provision which will increase <strong>the</strong> total health benefits<br />
delivered for <strong>the</strong> same cost to <strong>the</strong> taxpayer.<br />
8