Understanding the Public Services Industy
Understanding the Public Services Industy
Understanding the Public Services Industy

Create successful ePaper yourself
Turn your PDF publications into a flip-book with our unique Google optimized e-Paper software.
<strong>Public</strong> <strong>Services</strong> Industry Review<br />
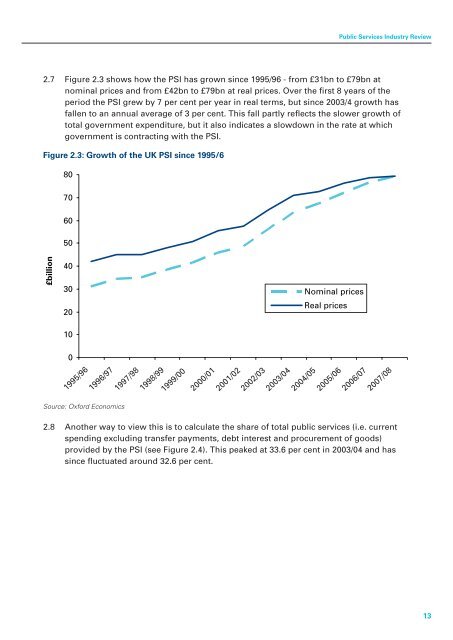
2.7 Figure 2.3 shows how <strong>the</strong> PSI has grown since 1995/96 - from £31bn to £79bn at<br />
nominal prices and from £42bn to £79bn at real prices. Over <strong>the</strong> first 8 years of <strong>the</strong><br />
period <strong>the</strong> PSI grew by 7 per cent per year in real terms, but since 2003/4 growth has<br />
fallen to an annual average of 3 per cent. This fall partly reflects <strong>the</strong> slower growth of<br />
total government expenditure, but it also indicates a slowdown in <strong>the</strong> rate at which<br />
government is contracting with <strong>the</strong> PSI.<br />
Figure 2.3: Growth of <strong>the</strong> UK PSI since 1995/6<br />
80<br />
70<br />
60<br />
50<br />
£billion<br />
40<br />
30<br />
20<br />
Nominal prices<br />
Real prices<br />
10<br />
0<br />
1995/96<br />
1996/97<br />
1997/98<br />
1998/99<br />
1999/00<br />
2000/01<br />
2001/02<br />
2002/03<br />
2003/04<br />
2004/05<br />
2005/06<br />
2006/07<br />
2007/08<br />
Source: Oxford Economics<br />
2.8 Ano<strong>the</strong>r way to view this is to calculate <strong>the</strong> share of total public services (i.e. current<br />
spending excluding transfer payments, debt interest and procurement of goods)<br />
provided by <strong>the</strong> PSI (see Figure 2.4). This peaked at 33.6 per cent in 2003/04 and has<br />
since fluctuated around 32.6 per cent.<br />
13