Understanding the Public Services Industy
Understanding the Public Services Industy
Understanding the Public Services Industy

Create successful ePaper yourself
Turn your PDF publications into a flip-book with our unique Google optimized e-Paper software.
<strong>Public</strong> <strong>Services</strong> Industry Review<br />
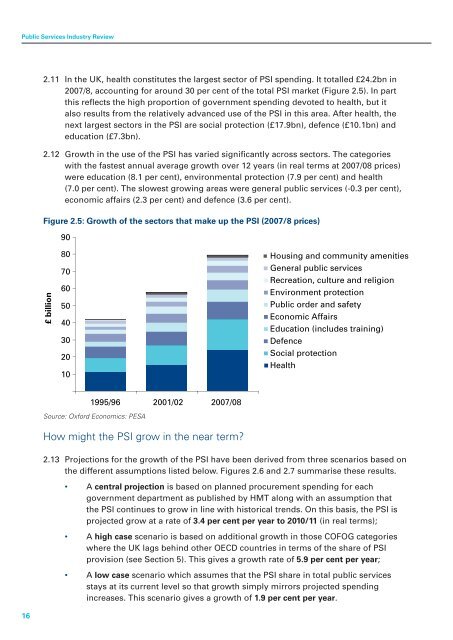
2.11 In <strong>the</strong> UK, health constitutes <strong>the</strong> largest sector of PSI spending. It totalled £24.2bn in<br />
2007/8, accounting for around 30 per cent of <strong>the</strong> total PSI market (Figure 2.5). In part<br />
this reflects <strong>the</strong> high proportion of government spending devoted to health, but it<br />
also results from <strong>the</strong> relatively advanced use of <strong>the</strong> PSI in this area. After health, <strong>the</strong><br />
next largest sectors in <strong>the</strong> PSI are social protection (£17.9bn), defence (£10.1bn) and<br />
education (£7.3bn).<br />
2.12 Growth in <strong>the</strong> use of <strong>the</strong> PSI has varied significantly across sectors. The categories<br />
with <strong>the</strong> fastest annual average growth over 12 years (in real terms at 2007/08 prices)<br />
were education (8.1 per cent), environmental protection (7.9 per cent) and health<br />
(7.0 per cent). The slowest growing areas were general public services (-0.3 per cent),<br />
economic affairs (2.3 per cent) and defence (3.6 per cent).<br />
Figure 2.5: Growth of <strong>the</strong> sectors that make up <strong>the</strong> PSI (2007/8 prices)<br />
90<br />
£ billion<br />
80<br />
70<br />
60<br />
50<br />
40<br />
30<br />
20<br />
10<br />
Housing and community amenities<br />
General public services<br />
Recreation, culture and religion<br />
Environment protection<br />
<strong>Public</strong> order and safety<br />
Economic Affairs<br />
Education (includes training)<br />
Defence<br />
Social protection<br />
Health<br />
1995/96 2001/02 2007/08<br />
Source: Oxford Economics: PESA<br />
How might <strong>the</strong> PSI grow in <strong>the</strong> near term?<br />
2.13 Projections for <strong>the</strong> growth of <strong>the</strong> PSI have been derived from three scenarios based on<br />
<strong>the</strong> different assumptions listed below. Figures 2.6 and 2.7 summarise <strong>the</strong>se results.<br />
• A central projection is based on planned procurement spending for each<br />
government department as published by HMT along with an assumption that<br />
<strong>the</strong> PSI continues to grow in line with historical trends. On this basis, <strong>the</strong> PSI is<br />
projected grow at a rate of 3.4 per cent per year to 2010/11 (in real terms);<br />
• A high case scenario is based on additional growth in those COFOG categories<br />
where <strong>the</strong> UK lags behind o<strong>the</strong>r OECD countries in terms of <strong>the</strong> share of PSI<br />
provision (see Section 5). This gives a growth rate of 5.9 per cent per year;<br />
A • low case scenario which assumes that <strong>the</strong> PSI share in total public services<br />
stays at its current level so that growth simply mirrors projected spending<br />
increases. This scenario gives a growth of 1.9 per cent per year.<br />
16