Understanding the Public Services Industy
Understanding the Public Services Industy
Understanding the Public Services Industy

You also want an ePaper? Increase the reach of your titles
YUMPU automatically turns print PDFs into web optimized ePapers that Google loves.
<strong>Public</strong> <strong>Services</strong> Industry Review<br />
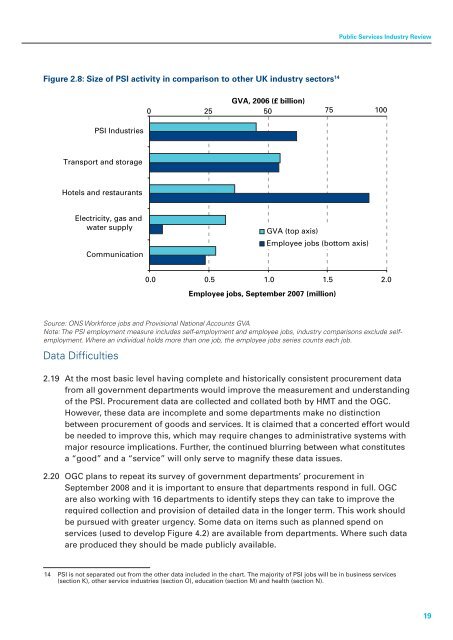
Figure 2.8: Size of PSI activity in comparison to o<strong>the</strong>r UK industry sectors 14<br />
GVA, 2006 (£ billion)<br />
0 25<br />
50<br />
75 100<br />
PSI Industries<br />
Transport and storage<br />
Hotels and restaurants<br />
Electricity, gas and<br />
water supply<br />
Communication<br />
GVA (top axis)<br />
Employee jobs (bottom axis)<br />
0.0 0.5 1.0 1.5 2.0<br />
Employee jobs, September 2007 (million)<br />
Source: ONS Workforce jobs and Provisional National Accounts GVA<br />
Note: The PSI employment measure includes self-employment and employee jobs, industry comparisons exclude selfemployment.<br />
Where an individual holds more than one job, <strong>the</strong> employee jobs series counts each job.<br />
Data Difficulties<br />
2.19 At <strong>the</strong> most basic level having complete and historically consistent procurement data<br />
from all government departments would improve <strong>the</strong> measurement and understanding<br />
of <strong>the</strong> PSI. Procurement data are collected and collated both by HMT and <strong>the</strong> OGC.<br />
However, <strong>the</strong>se data are incomplete and some departments make no distinction<br />
between procurement of goods and services. It is claimed that a concerted effort would<br />
be needed to improve this, which may require changes to administrative systems with<br />
major resource implications. Fur<strong>the</strong>r, <strong>the</strong> continued blurring between what constitutes<br />
a “good” and a “service” will only serve to magnify <strong>the</strong>se data issues.<br />
2.20 OGC plans to repeat its survey of government departments’ procurement in<br />
September 2008 and it is important to ensure that departments respond in full. OGC<br />
are also working with 16 departments to identify steps <strong>the</strong>y can take to improve <strong>the</strong><br />
required collection and provision of detailed data in <strong>the</strong> longer term. This work should<br />
be pursued with greater urgency. Some data on items such as planned spend on<br />
services (used to develop Figure 4.2) are available from departments. Where such data<br />
are produced <strong>the</strong>y should be made publicly available.<br />
14 PSI is not separated out from <strong>the</strong> o<strong>the</strong>r data included in <strong>the</strong> chart. The majority of PSI jobs will be in business services<br />
(section K), o<strong>the</strong>r service industries (section O), education (section M) and health (section N).<br />
19