Understanding the Public Services Industy
Understanding the Public Services Industy
Understanding the Public Services Industy

Create successful ePaper yourself
Turn your PDF publications into a flip-book with our unique Google optimized e-Paper software.
<strong>Public</strong> <strong>Services</strong> Industry Review<br />
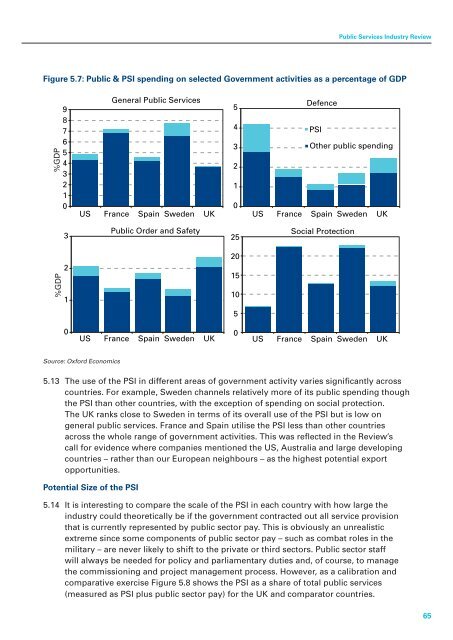
Figure 5.7: <strong>Public</strong> & PSI spending on selected Government activities as a percentage of GDP<br />
%GDP<br />
9<br />
8<br />
7<br />
6<br />
5<br />
4<br />
3<br />
2<br />
1<br />
0<br />
General <strong>Public</strong> <strong>Services</strong><br />
5<br />
Defence<br />
4<br />
PSI<br />
3<br />
O<strong>the</strong>r public spending<br />
2<br />
1<br />
0<br />
US France Spain Sweden UK US France Spain Sweden UK<br />
3<br />
<strong>Public</strong> Order and Safety<br />
25<br />
Social Protection<br />
%GDP<br />
2<br />
1<br />
20<br />
15<br />
10<br />
5<br />
0<br />
US France Spain Sweden UK<br />
0<br />
US France Spain Sweden UK<br />
Source: Oxford Economics<br />
5.13 The use of <strong>the</strong> PSI in different areas of government activity varies significantly across<br />
countries. For example, Sweden channels relatively more of its public spending though<br />
<strong>the</strong> PSI than o<strong>the</strong>r countries, with <strong>the</strong> exception of spending on social protection.<br />
The UK ranks close to Sweden in terms of its overall use of <strong>the</strong> PSI but is low on<br />
general public services. France and Spain utilise <strong>the</strong> PSI less than o<strong>the</strong>r countries<br />
across <strong>the</strong> whole range of government activities. This was reflected in <strong>the</strong> Review’s<br />
call for evidence where companies mentioned <strong>the</strong> US, Australia and large developing<br />
countries – ra<strong>the</strong>r than our European neighbours – as <strong>the</strong> highest potential export<br />
opportunities.<br />
Potential Size of <strong>the</strong> PSI<br />
5.14 It is interesting to compare <strong>the</strong> scale of <strong>the</strong> PSI in each country with how large <strong>the</strong><br />
industry could <strong>the</strong>oretically be if <strong>the</strong> government contracted out all service provision<br />
that is currently represented by public sector pay. This is obviously an unrealistic<br />
extreme since some components of public sector pay – such as combat roles in <strong>the</strong><br />
military – are never likely to shift to <strong>the</strong> private or third sectors. <strong>Public</strong> sector staff<br />
will always be needed for policy and parliamentary duties and, of course, to manage<br />
<strong>the</strong> commissioning and project management process. However, as a calibration and<br />
comparative exercise Figure 5.8 shows <strong>the</strong> PSI as a share of total public services<br />
(measured as PSI plus public sector pay) for <strong>the</strong> UK and comparator countries.<br />
65