Understanding the Public Services Industy
Understanding the Public Services Industy
Understanding the Public Services Industy

Create successful ePaper yourself
Turn your PDF publications into a flip-book with our unique Google optimized e-Paper software.
<strong>Public</strong> <strong>Services</strong> Industry Review<br />
with very low private spending and relatively low public spending. However it has a<br />
substantially larger health PSI as a share of GDP than <strong>the</strong> o<strong>the</strong>r countries 65 .<br />
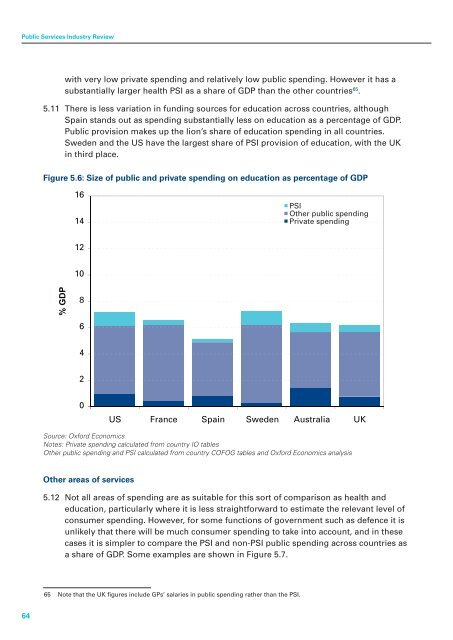
5.11 There is less variation in funding sources for education across countries, although<br />
Spain stands out as spending substantially less on education as a percentage of GDP.<br />
<strong>Public</strong> provision makes up <strong>the</strong> lion’s share of education spending in all countries.<br />
Sweden and <strong>the</strong> US have <strong>the</strong> largest share of PSI provision of education, with <strong>the</strong> UK<br />
in third place.<br />
Figure 5.6: Size of public and private spending on education as percentage of GDP<br />
16<br />
14<br />
PSI<br />
O<strong>the</strong>r public spending<br />
Private spending<br />
12<br />
10<br />
% GDP<br />
8<br />
6<br />
4<br />
2<br />
0<br />
US France Spain Sweden Australia UK<br />
Source: Oxford Economics<br />
Notes: Private spending calculated from country IO tables<br />
O<strong>the</strong>r public spending and PSI calculated from country COFOG tables and Oxford Economics analysis<br />
O<strong>the</strong>r areas of services<br />
5.12 Not all areas of spending are as suitable for this sort of comparison as health and<br />
education, particularly where it is less straightforward to estimate <strong>the</strong> relevant level of<br />
consumer spending. However, for some functions of government such as defence it is<br />
unlikely that <strong>the</strong>re will be much consumer spending to take into account, and in <strong>the</strong>se<br />
cases it is simpler to compare <strong>the</strong> PSI and non-PSI public spending across countries as<br />
a share of GDP. Some examples are shown in Figure 5.7.<br />
65 Note that <strong>the</strong> UK figures include GPs’ salaries in public spending ra<strong>the</strong>r than <strong>the</strong> PSI.<br />
64