Understanding the Public Services Industy
Understanding the Public Services Industy
Understanding the Public Services Industy

You also want an ePaper? Increase the reach of your titles
YUMPU automatically turns print PDFs into web optimized ePapers that Google loves.
<strong>Public</strong> <strong>Services</strong> Industry Review<br />
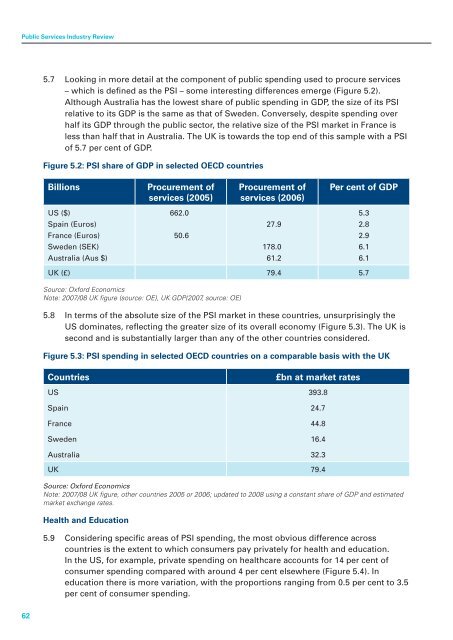
5.7 Looking in more detail at <strong>the</strong> component of public spending used to procure services<br />
– which is defined as <strong>the</strong> PSI – some interesting differences emerge (Figure 5.2).<br />
Although Australia has <strong>the</strong> lowest share of public spending in GDP, <strong>the</strong> size of its PSI<br />
relative to its GDP is <strong>the</strong> same as that of Sweden. Conversely, despite spending over<br />
half its GDP through <strong>the</strong> public sector, <strong>the</strong> relative size of <strong>the</strong> PSI market in France is<br />
less than half that in Australia. The UK is towards <strong>the</strong> top end of this sample with a PSI<br />
of 5.7 per cent of GDP.<br />
Figure 5.2: PSI share of GDP in selected OECD countries<br />
Billions<br />
Procurement of<br />
services (2005)<br />
Procurement of<br />
services (2006)<br />
Per cent of GDP<br />
US ($)<br />
662.0<br />
5.3<br />
Spain (Euros)<br />
27.9<br />
2.8<br />
France (Euros)<br />
50.6<br />
2.9<br />
Sweden (SEK)<br />
178.0<br />
6.1<br />
Australia (Aus $)<br />
61.2<br />
6.1<br />
UK (£) 79.4 5.7<br />
Source: Oxford Economics<br />
Note: 2007/08 UK figure (source: OE), UK GDP(2007, source: OE)<br />
5.8 In terms of <strong>the</strong> absolute size of <strong>the</strong> PSI market in <strong>the</strong>se countries, unsurprisingly <strong>the</strong><br />
US dominates, reflecting <strong>the</strong> greater size of its overall economy (Figure 5.3). The UK is<br />
second and is substantially larger than any of <strong>the</strong> o<strong>the</strong>r countries considered.<br />
Figure 5.3: PSI spending in selected OECD countries on a comparable basis with <strong>the</strong> UK<br />
Countries<br />
US<br />
Spain<br />
France<br />
Sweden<br />
Australia<br />
£bn at market rates<br />
393.8<br />
24.7<br />
44.8<br />
16.4<br />
32.3<br />
UK 79.4<br />
Source: Oxford Economics<br />
Note: 2007/08 UK figure, o<strong>the</strong>r countries 2005 or 2006; updated to 2008 using a constant share of GDP and estimated<br />
market exchange rates.<br />
Health and Education<br />
5.9 Considering specific areas of PSI spending, <strong>the</strong> most obvious difference across<br />
countries is <strong>the</strong> extent to which consumers pay privately for health and education.<br />
In <strong>the</strong> US, for example, private spending on healthcare accounts for 14 per cent of<br />
consumer spending compared with around 4 per cent elsewhere (Figure 5.4). In<br />
education <strong>the</strong>re is more variation, with <strong>the</strong> proportions ranging from 0.5 per cent to 3.5<br />
per cent of consumer spending.<br />
62