Simplification is the key - Centre for Policy Studies
Simplification is the key - Centre for Policy Studies
Simplification is the key - Centre for Policy Studies

You also want an ePaper? Increase the reach of your titles
YUMPU automatically turns print PDFs into web optimized ePapers that Google loves.
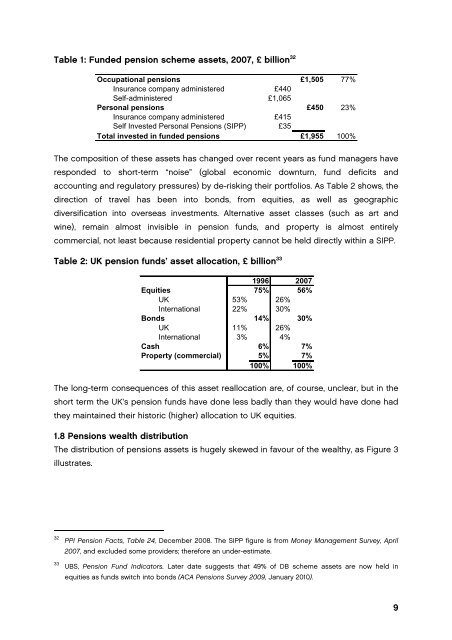
Table 1: Funded pension scheme assets, 2007, £ billion 32<br />
Occupational pensions £1,505 77%<br />
Insurance company admin<strong>is</strong>tered £440<br />
Self-admin<strong>is</strong>tered £1,065<br />
Personal pensions £450 23%<br />
Insurance company admin<strong>is</strong>tered £415<br />
Self Invested Personal Pensions (SIPP) £35<br />
Total invested in funded pensions £1,955 100%<br />
The composition of <strong>the</strong>se assets has changed over recent years as fund managers have<br />
responded to short-term “no<strong>is</strong>e” (global economic downturn, fund deficits and<br />
accounting and regulatory pressures) by de-r<strong>is</strong>king <strong>the</strong>ir portfolios. As Table 2 shows, <strong>the</strong><br />
direction of travel has been into bonds, from equities, as well as geographic<br />
diversification into overseas investments. Alternative asset classes (such as art and<br />
wine), remain almost inv<strong>is</strong>ible in pension funds, and property <strong>is</strong> almost entirely<br />
commercial, not least because residential property cannot be held directly within a SIPP.<br />
Table 2: UK pension funds’ asset allocation, £ billion 33<br />
1996 2007<br />
Equities 75% 56%<br />
UK 53% 26%<br />
International 22% 30%<br />
Bonds 14% 30%<br />
UK 11% 26%<br />
International 3% 4%<br />
Cash 6% 7%<br />
Property (commercial) 5% 7%<br />
100% 100%<br />
The long-term consequences of th<strong>is</strong> asset reallocation are, of course, unclear, but in <strong>the</strong><br />
short term <strong>the</strong> UK’s pension funds have done less badly than <strong>the</strong>y would have done had<br />
<strong>the</strong>y maintained <strong>the</strong>ir h<strong>is</strong>toric (higher) allocation to UK equities.<br />
1.8 Pensions wealth d<strong>is</strong>tribution<br />
The d<strong>is</strong>tribution of pensions assets <strong>is</strong> hugely skewed in favour of <strong>the</strong> wealthy, as Figure 3<br />
illustrates.<br />
32<br />
33<br />
PPI Pension Facts, Table 24, December 2008. The SIPP figure <strong>is</strong> from Money Management Survey, April<br />
2007, and excluded some providers; <strong>the</strong>re<strong>for</strong>e an under-estimate.<br />
UBS, Pension Fund Indicators. Later date suggests that 49% of DB scheme assets are now held in<br />
equities as funds switch into bonds (ACA Pensions Survey 2009, January 2010).<br />
9